The global financial landscape is currently undergoing its most significant transformation in decades. As we move through 2026, the traditional dominance of fiat based reserves is being challenged by a structural shift toward hard assets.
This report provides a deep dive analysis into the 2024–2026 supercycle in Gold and Silver, examining the convergence of geopolitical tension, fiscal instability, and a fundamental realignment of global liquidity.
By synthesising macroeconomic data with shifting sovereign risk perceptions, we outline why precious metals have transitioned from simple hedges into the primary engines of modern portfolio diversification.
Executive View: The Structural Foundation
Gold remains structurally supported by three distinct and powerful forces that define the current market regime:
Investment liquidity from global financial centers.
Asian physical demand combined with the strategic activities of central banks.
The diversification of global reserves away from concentrated USD exposure.
It is a vital premise for this analysis that the recent market correction was entirely liquidity driven and not a result of a collapse in structural demand. Gold has formally entered a structural supercycle, driven primarily by sovereign states.
For portfolio managers and private investors alike, gold remains one of the most effective and essential diversification tools in the modern financial era.
Liquidity Structure and the Geography of Global Flows
Price acceleration phases in the current environment are primarily driven by Western financial capital. This includes United States and European exchange traded funds, COMEX positioning, and over the counter flows cleared via London.
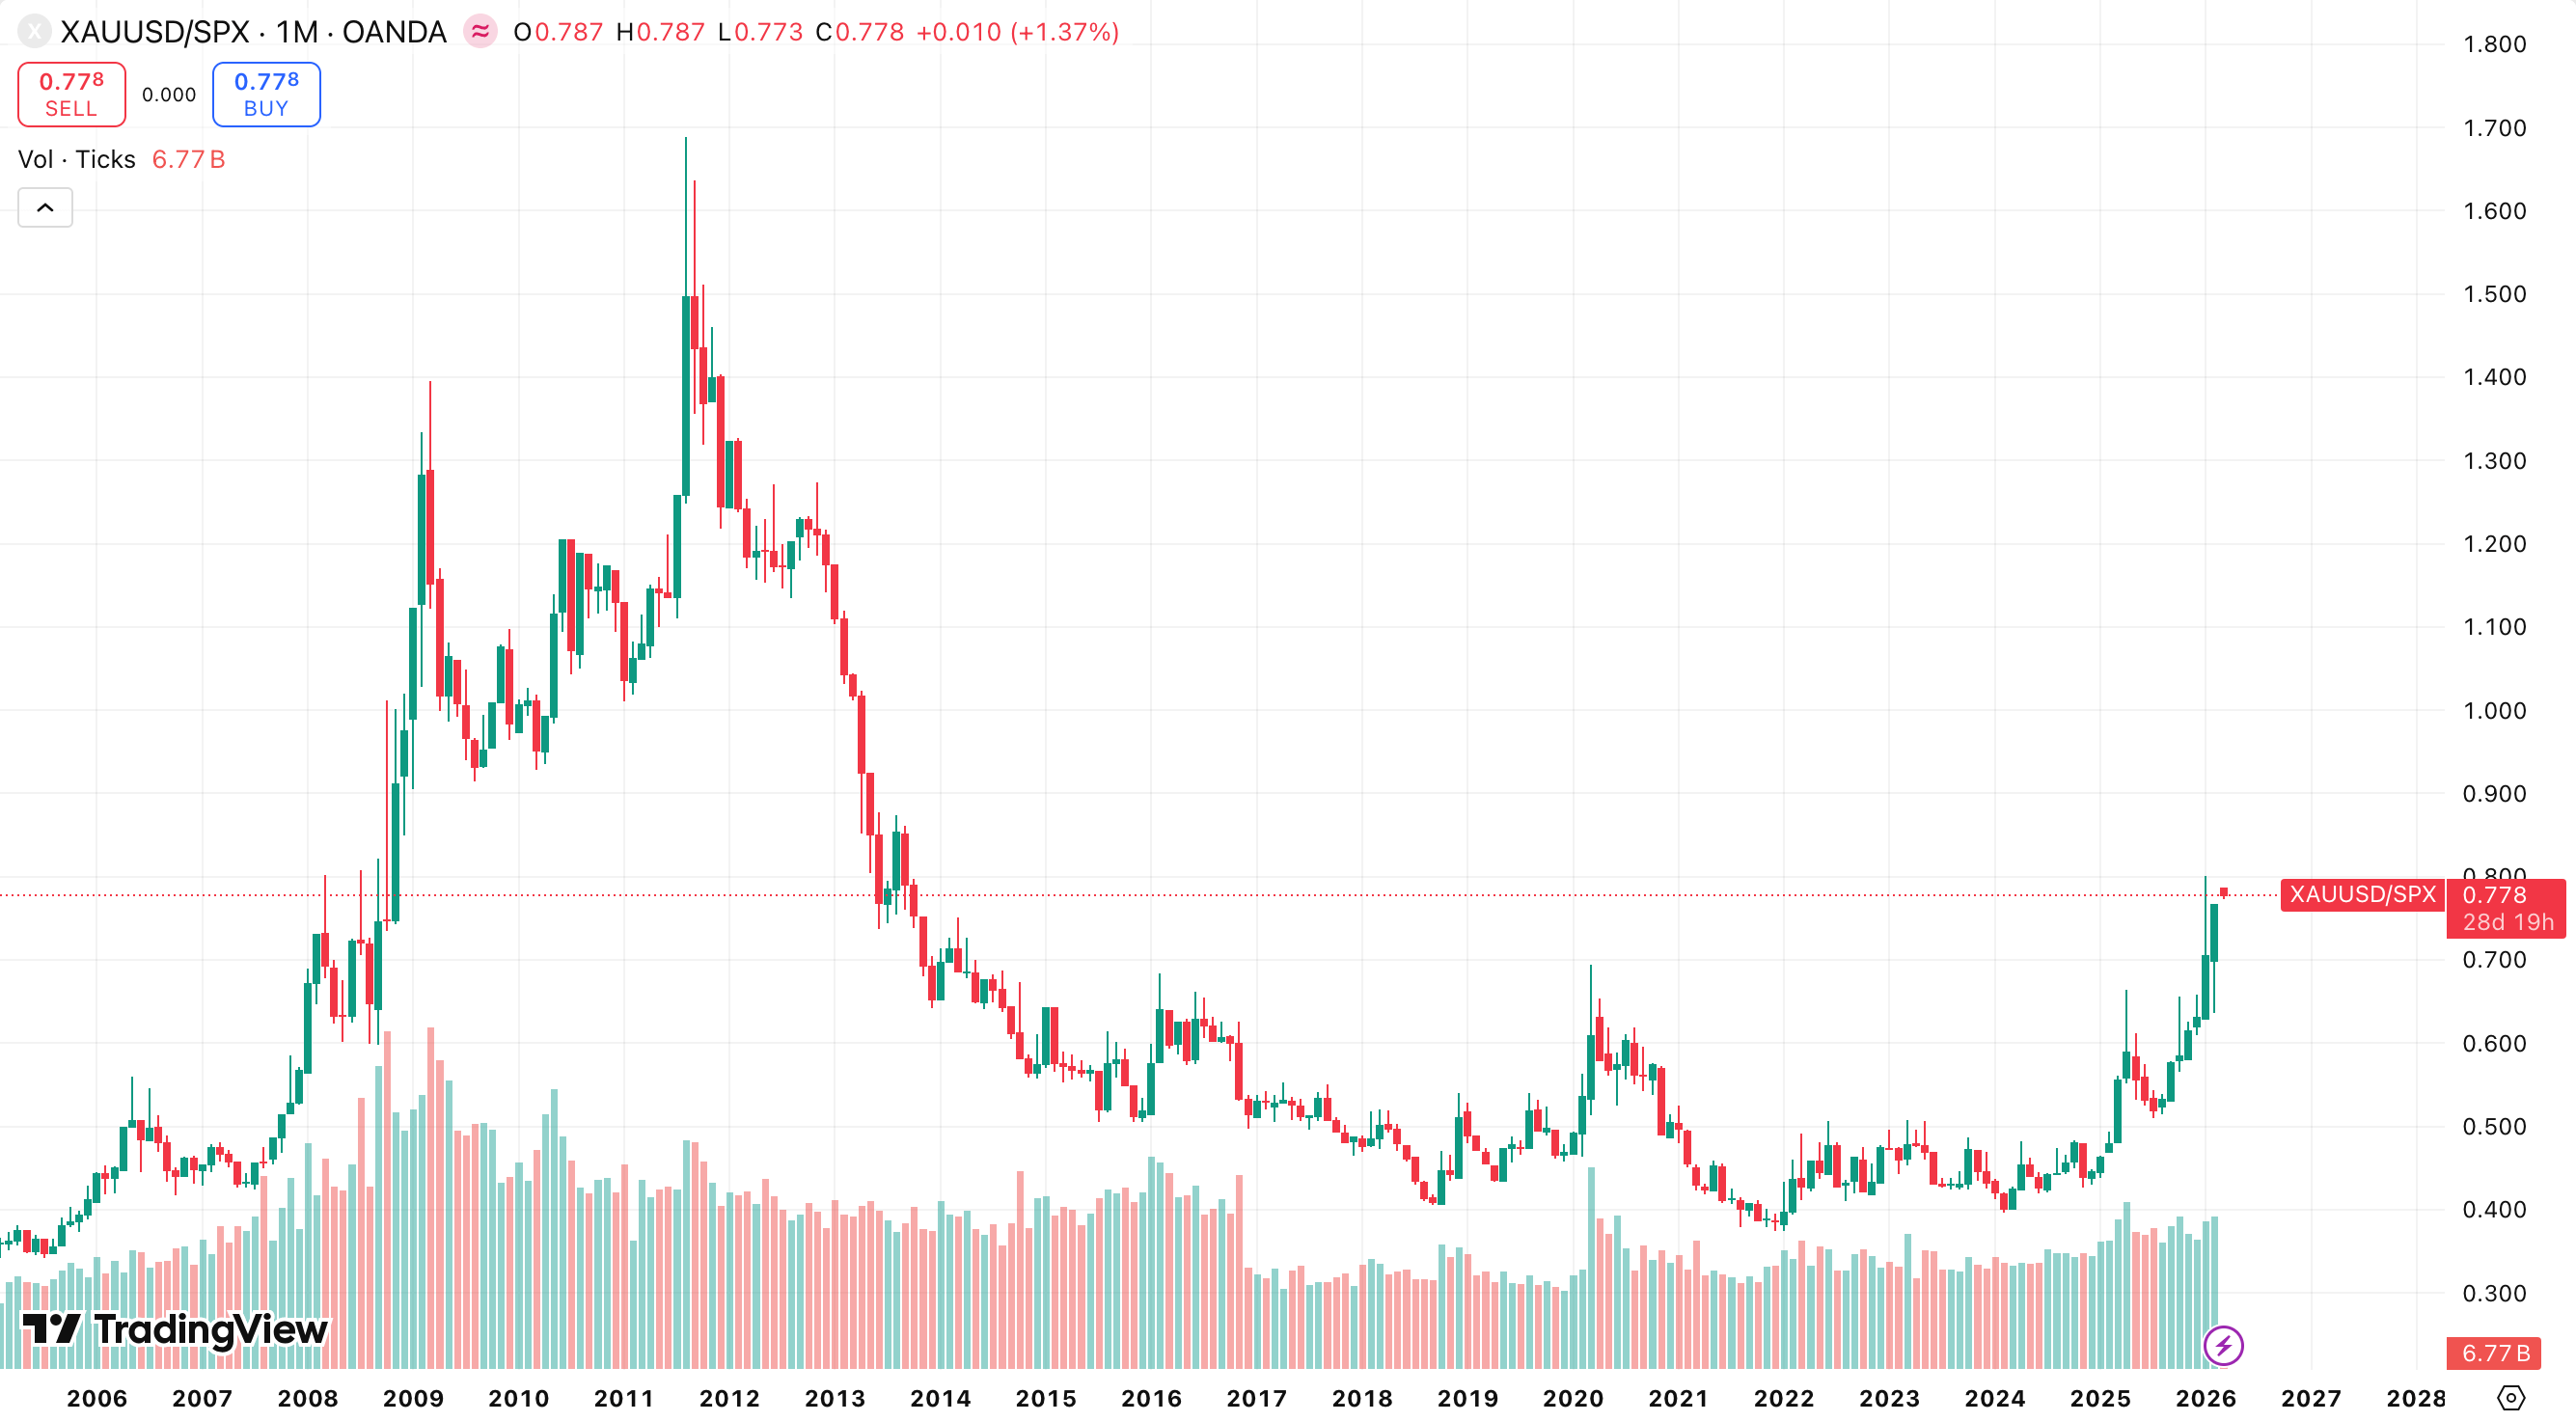
The year 2025 delivered one of the strongest accumulation cycles in exchange traded funds on record, with 801T added globally. This data confirms that macro allocation, rather than traditional jewelry demand, has become the dominant price driver.
When real yields decline or the USD weakens, these flows act as a powerful multiplier for the upside.
Conversely, Asian demand operates under a different logic. Markets in China, India, and the Middle East absorb pullbacks via the purchase of bars, coins, and local exchange traded funds. In India, there has been a significant shift from jewelry toward investment formats, even at elevated price levels.
Meanwhile, central bank purchases remain at historically high levels, reflecting a broad diversification from USD assets and an increased awareness of sanctions risks. Together, these factors create a permanent structural floor under the market.
Geographical Flow Centers
The global infrastructure of the gold market is divided into specific hubs:
London LBMA: Functions as the primary clearing and over the counter hub.
New York COMEX: The primary engine for leveraged positioning.
Shanghai, Hong Kong, and Dubai: These cities represent the global centers for physical absorption.
Analysis of market volatility shows that spikes typically originate from Western positioning resets, not from Asian liquidation. It is specifically the demand from Asia and the official sector, meaning central banks, that stabilises the market during corrections.
The Dynamics of Market Corrections
When corrections occur, the pressure generally originates from redemptions in exchange traded funds, leveraged futures liquidation on the COMEX, and an increase in recycling supply triggered by higher prices. It must be emphasised that these corrections are predominantly driven by financial flows rather than a collapse in physical demand.
Geopolitical Premium and the Weak USD Path
Since the pivotal events of 2022, central bank accumulation has remained elevated, and the share of gold in global reserves has seen a consistent increase.
The freeze of $300B in Russian reserves shifted the global perception of sovereign risk, embedding a structural geopolitical premium into gold pricing. This component is regime driven and structural, not cyclical.
The Weak USD Policy Scenario
Under the current administration path, if policy tilts toward competitive USD weakening and expanded trade measures to support domestic industry, the transmission mechanism for gold becomes clear:
USD Down: Supports gold mechanically.
Increased Trade Tensions: Increases the risk premium.
Real Yields Under Pressure: Accelerates allocation flows into precious metals.
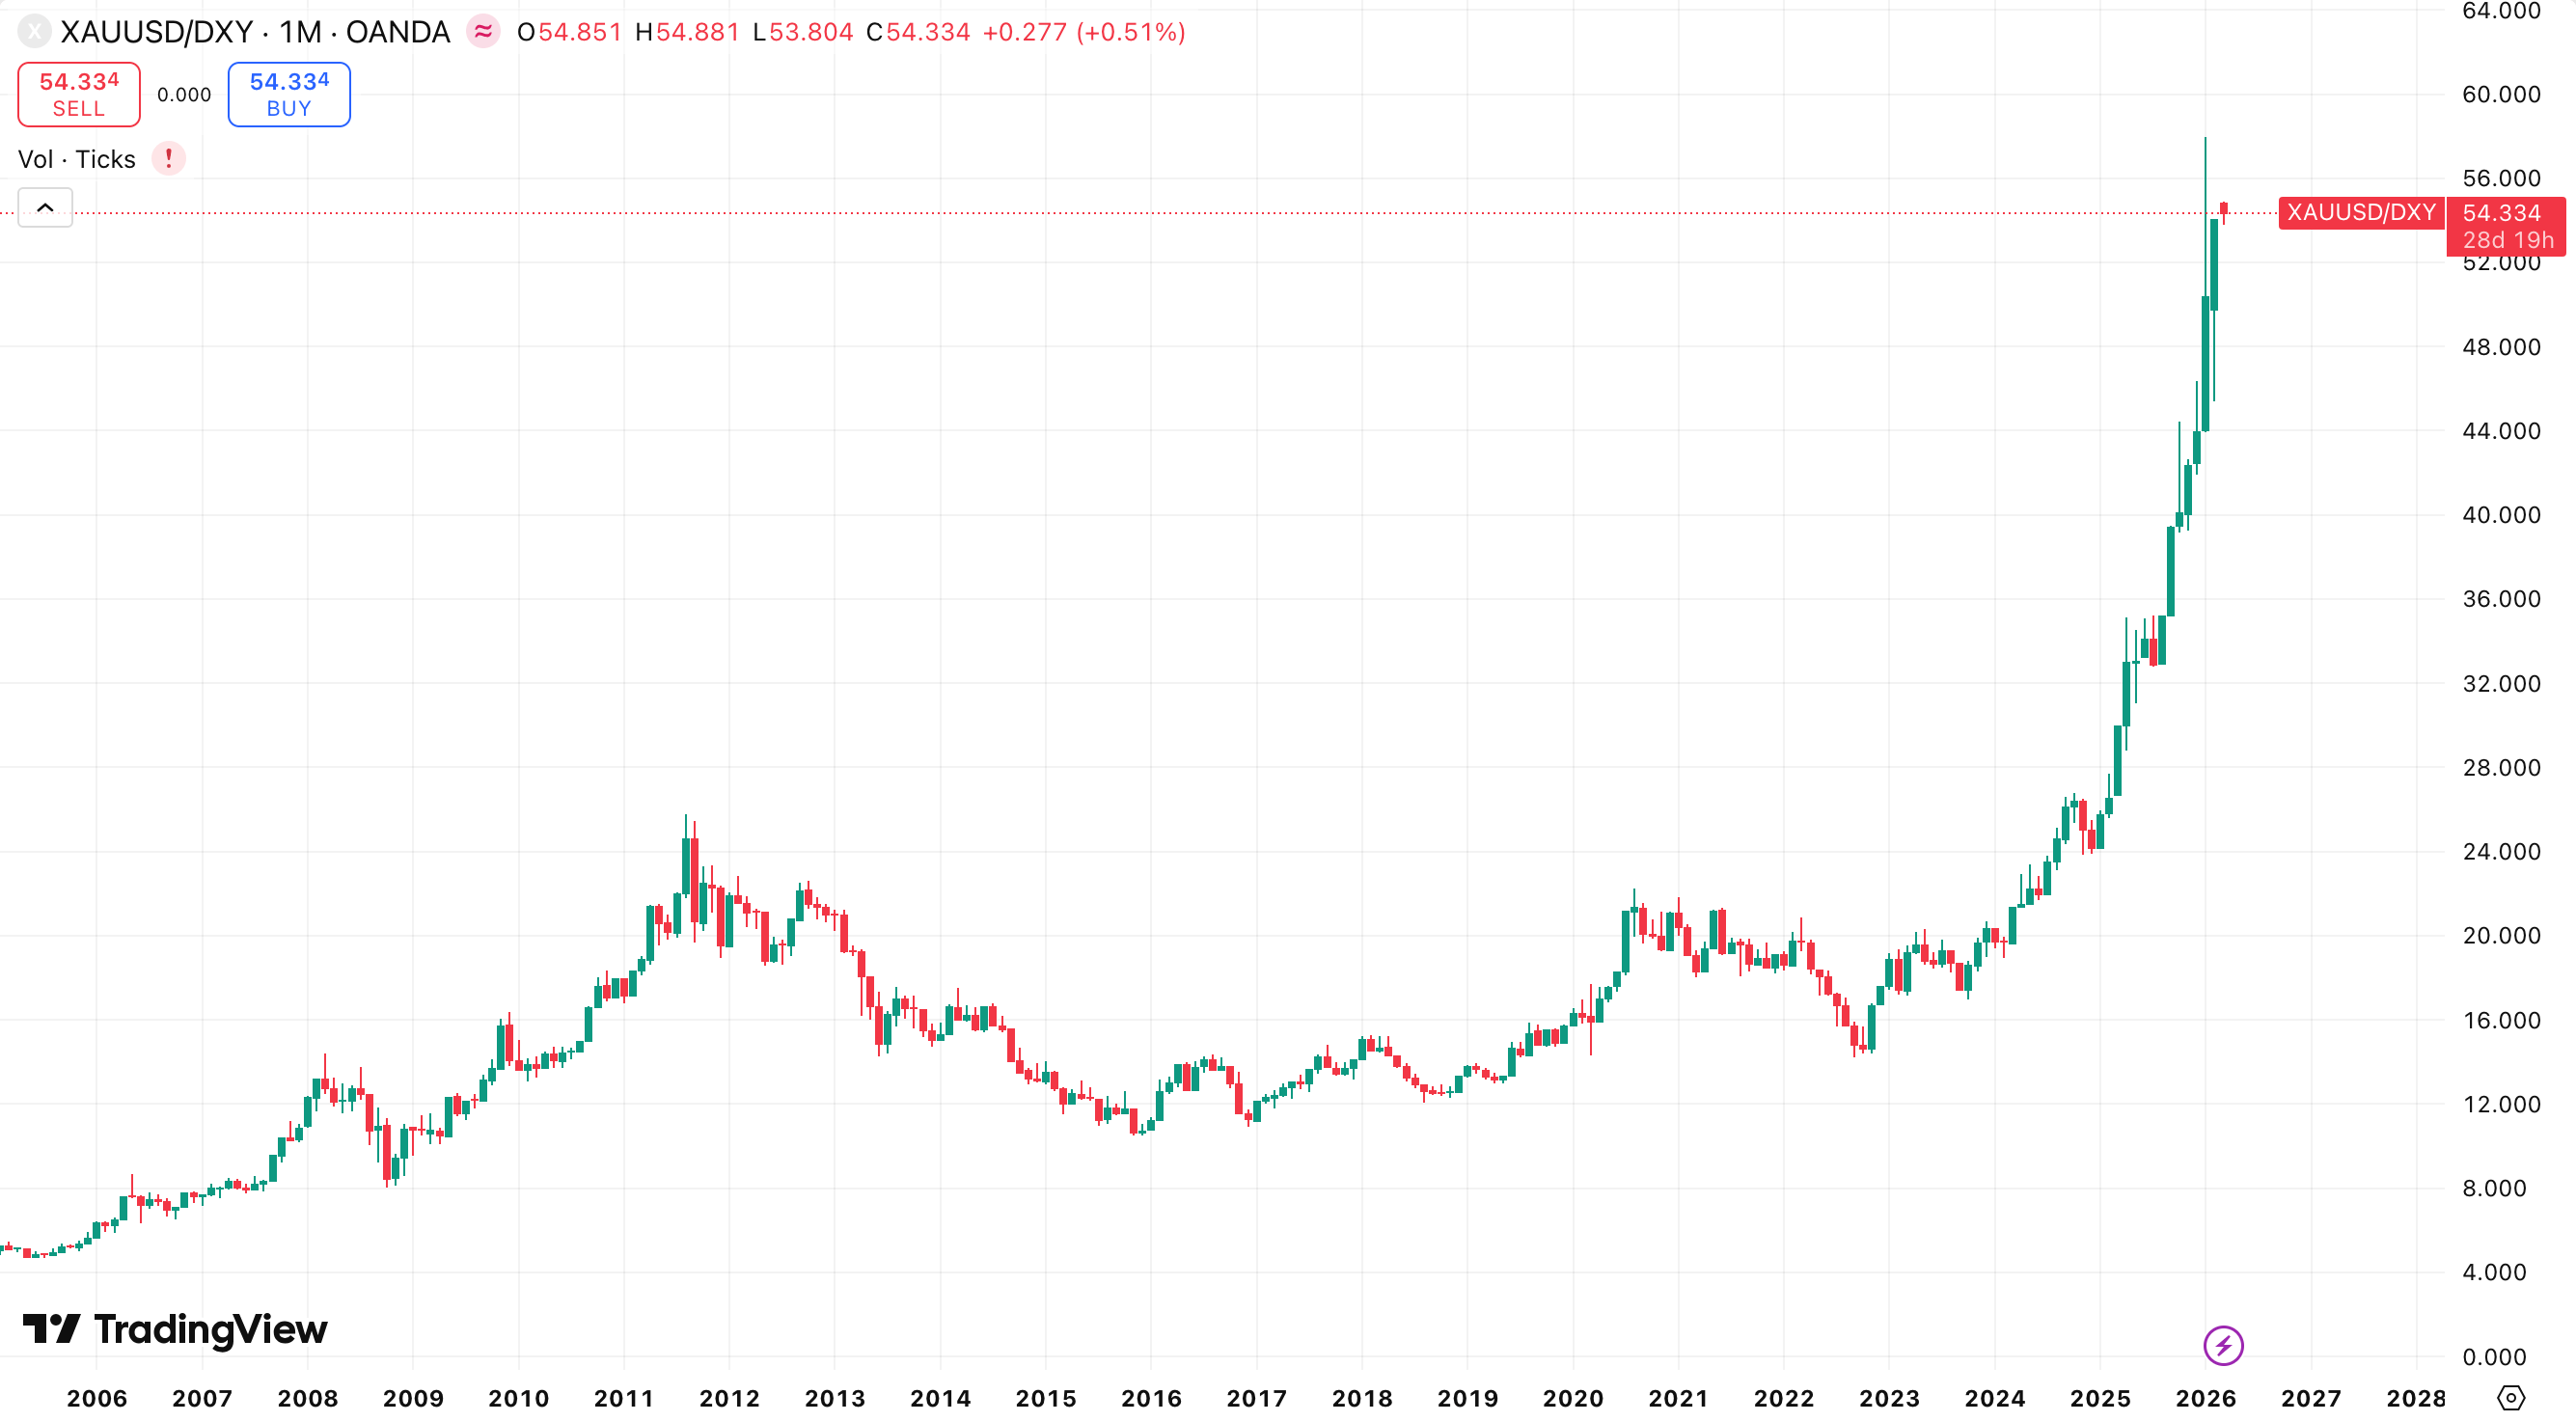
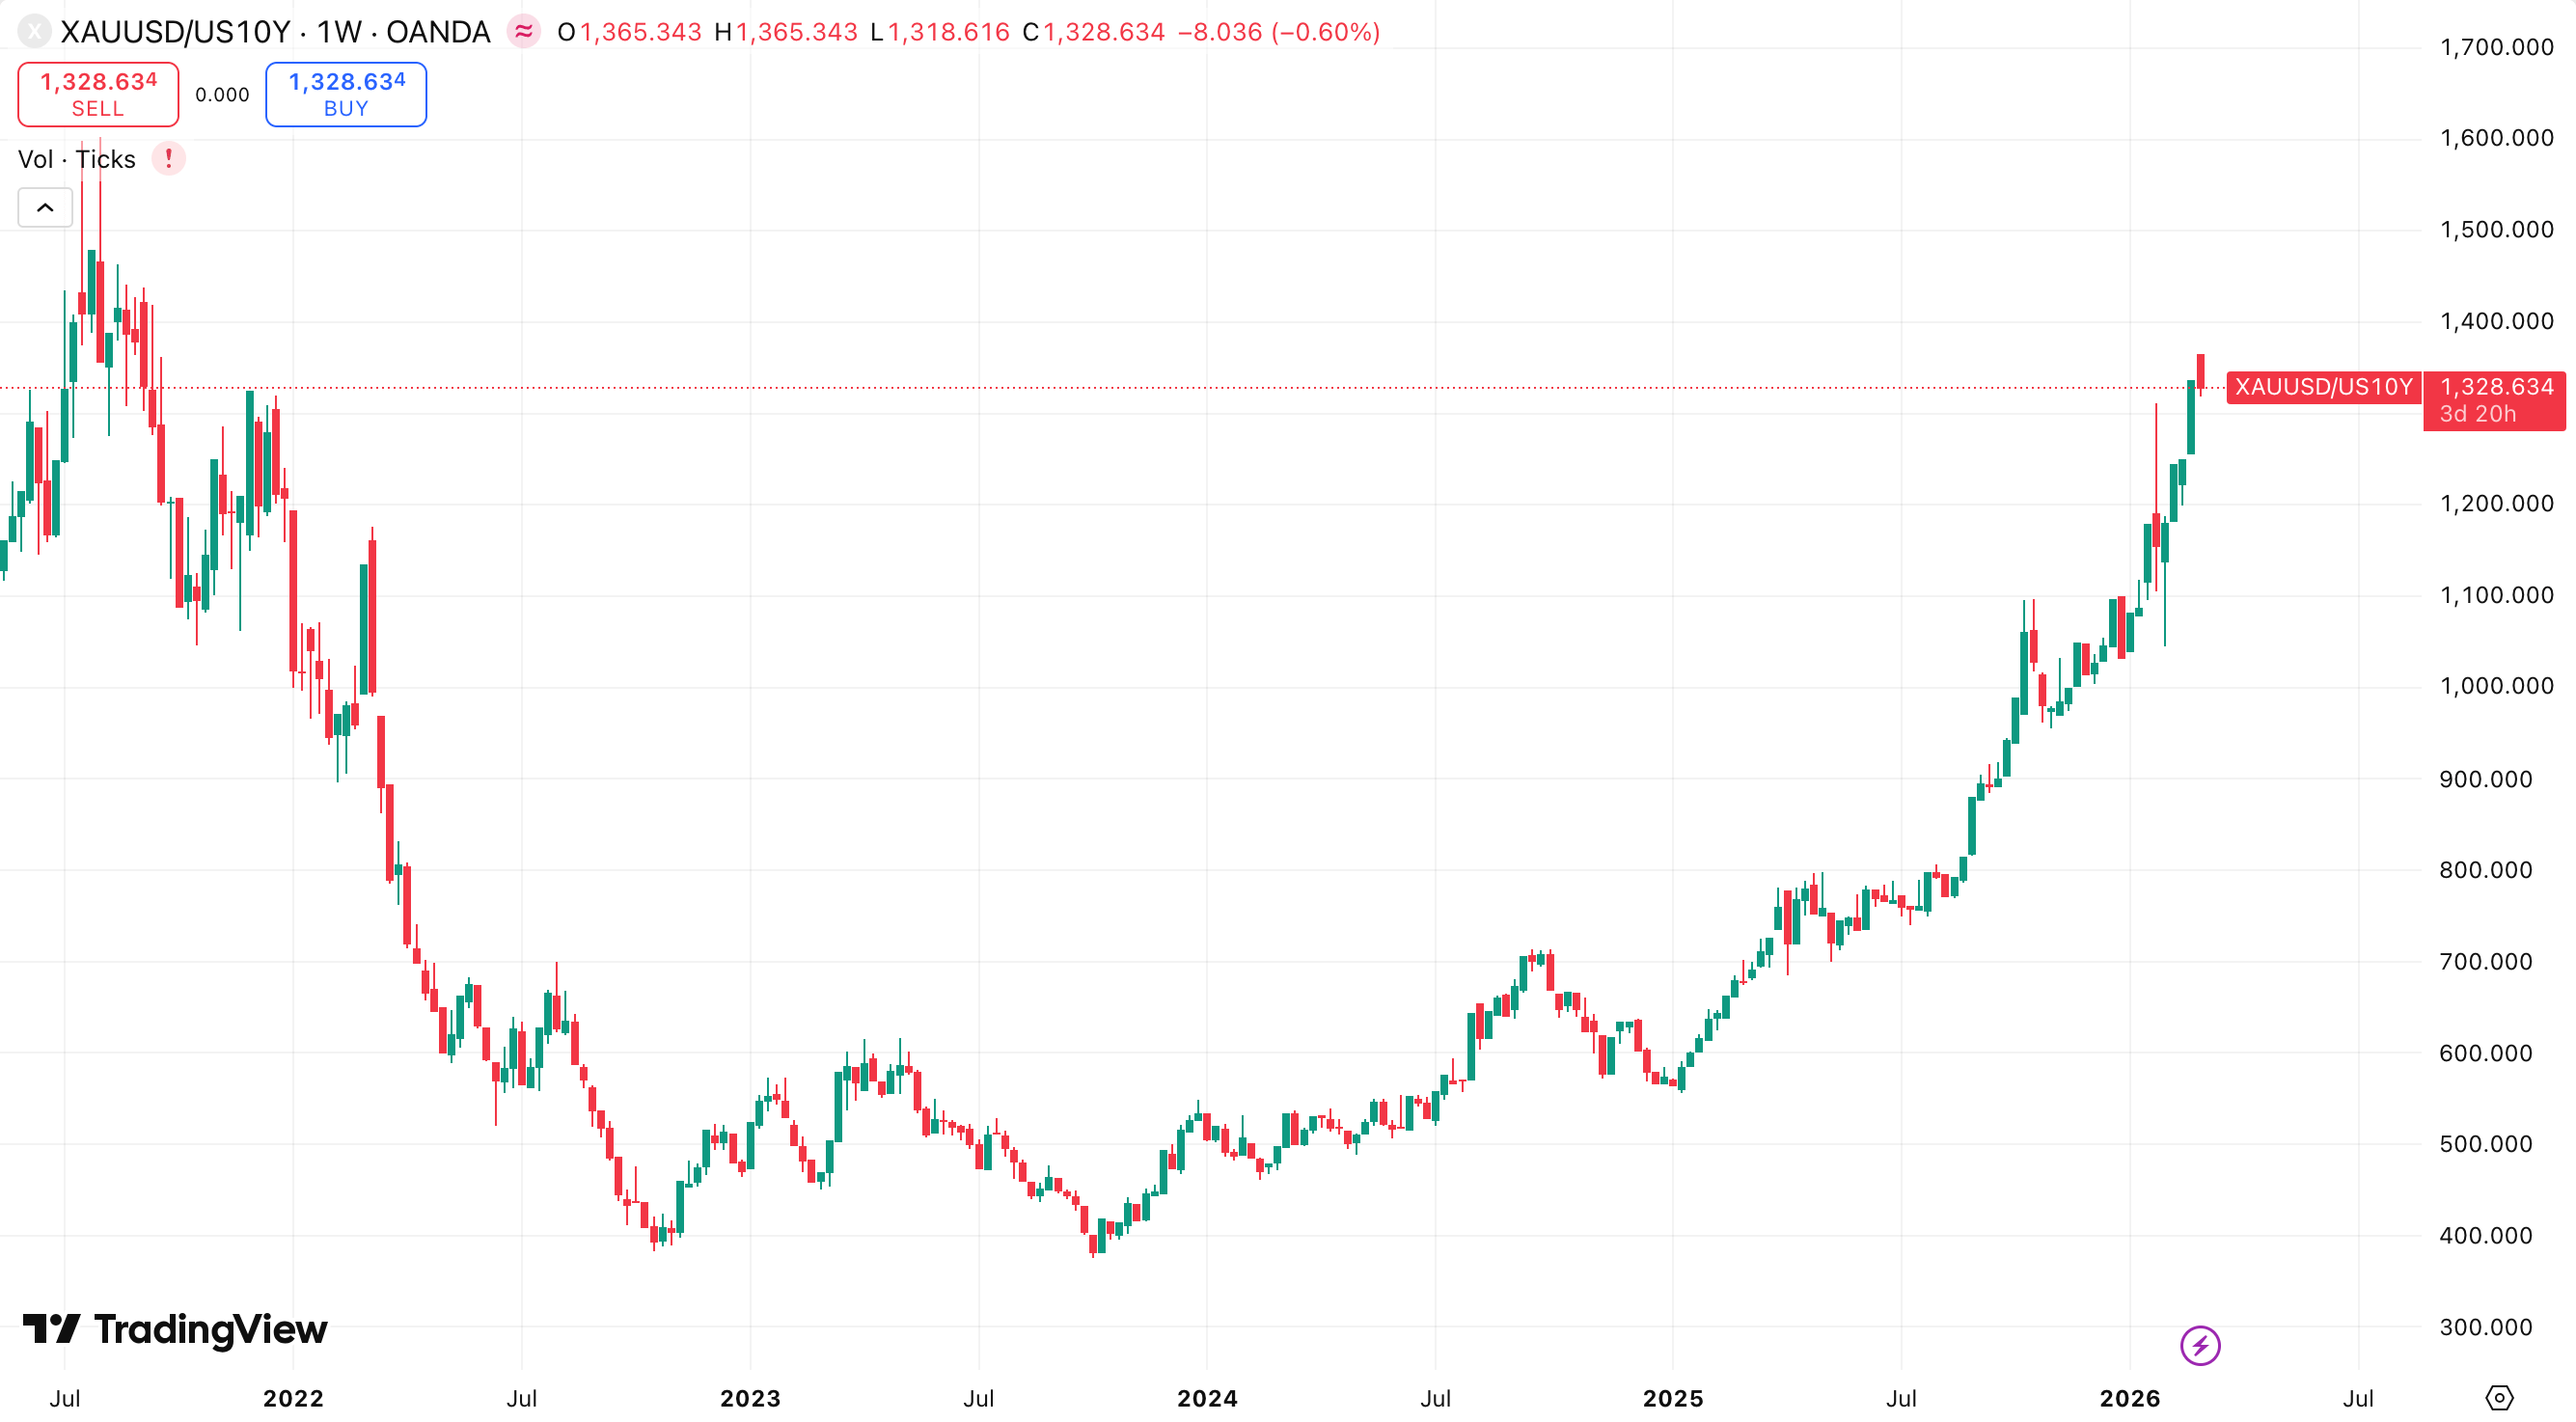
Confirmation signals for this scenario include a sustained downtrend in the DXY, declining 10 year real yields, renewed inflows into exchange traded funds, and an escalation in trade policy.
Under these conditions, gold could transition from its current steady uptrend into a phase of allocation driven acceleration.
The 2024–2026 Gold Rally: Four Reinforcing Pillars
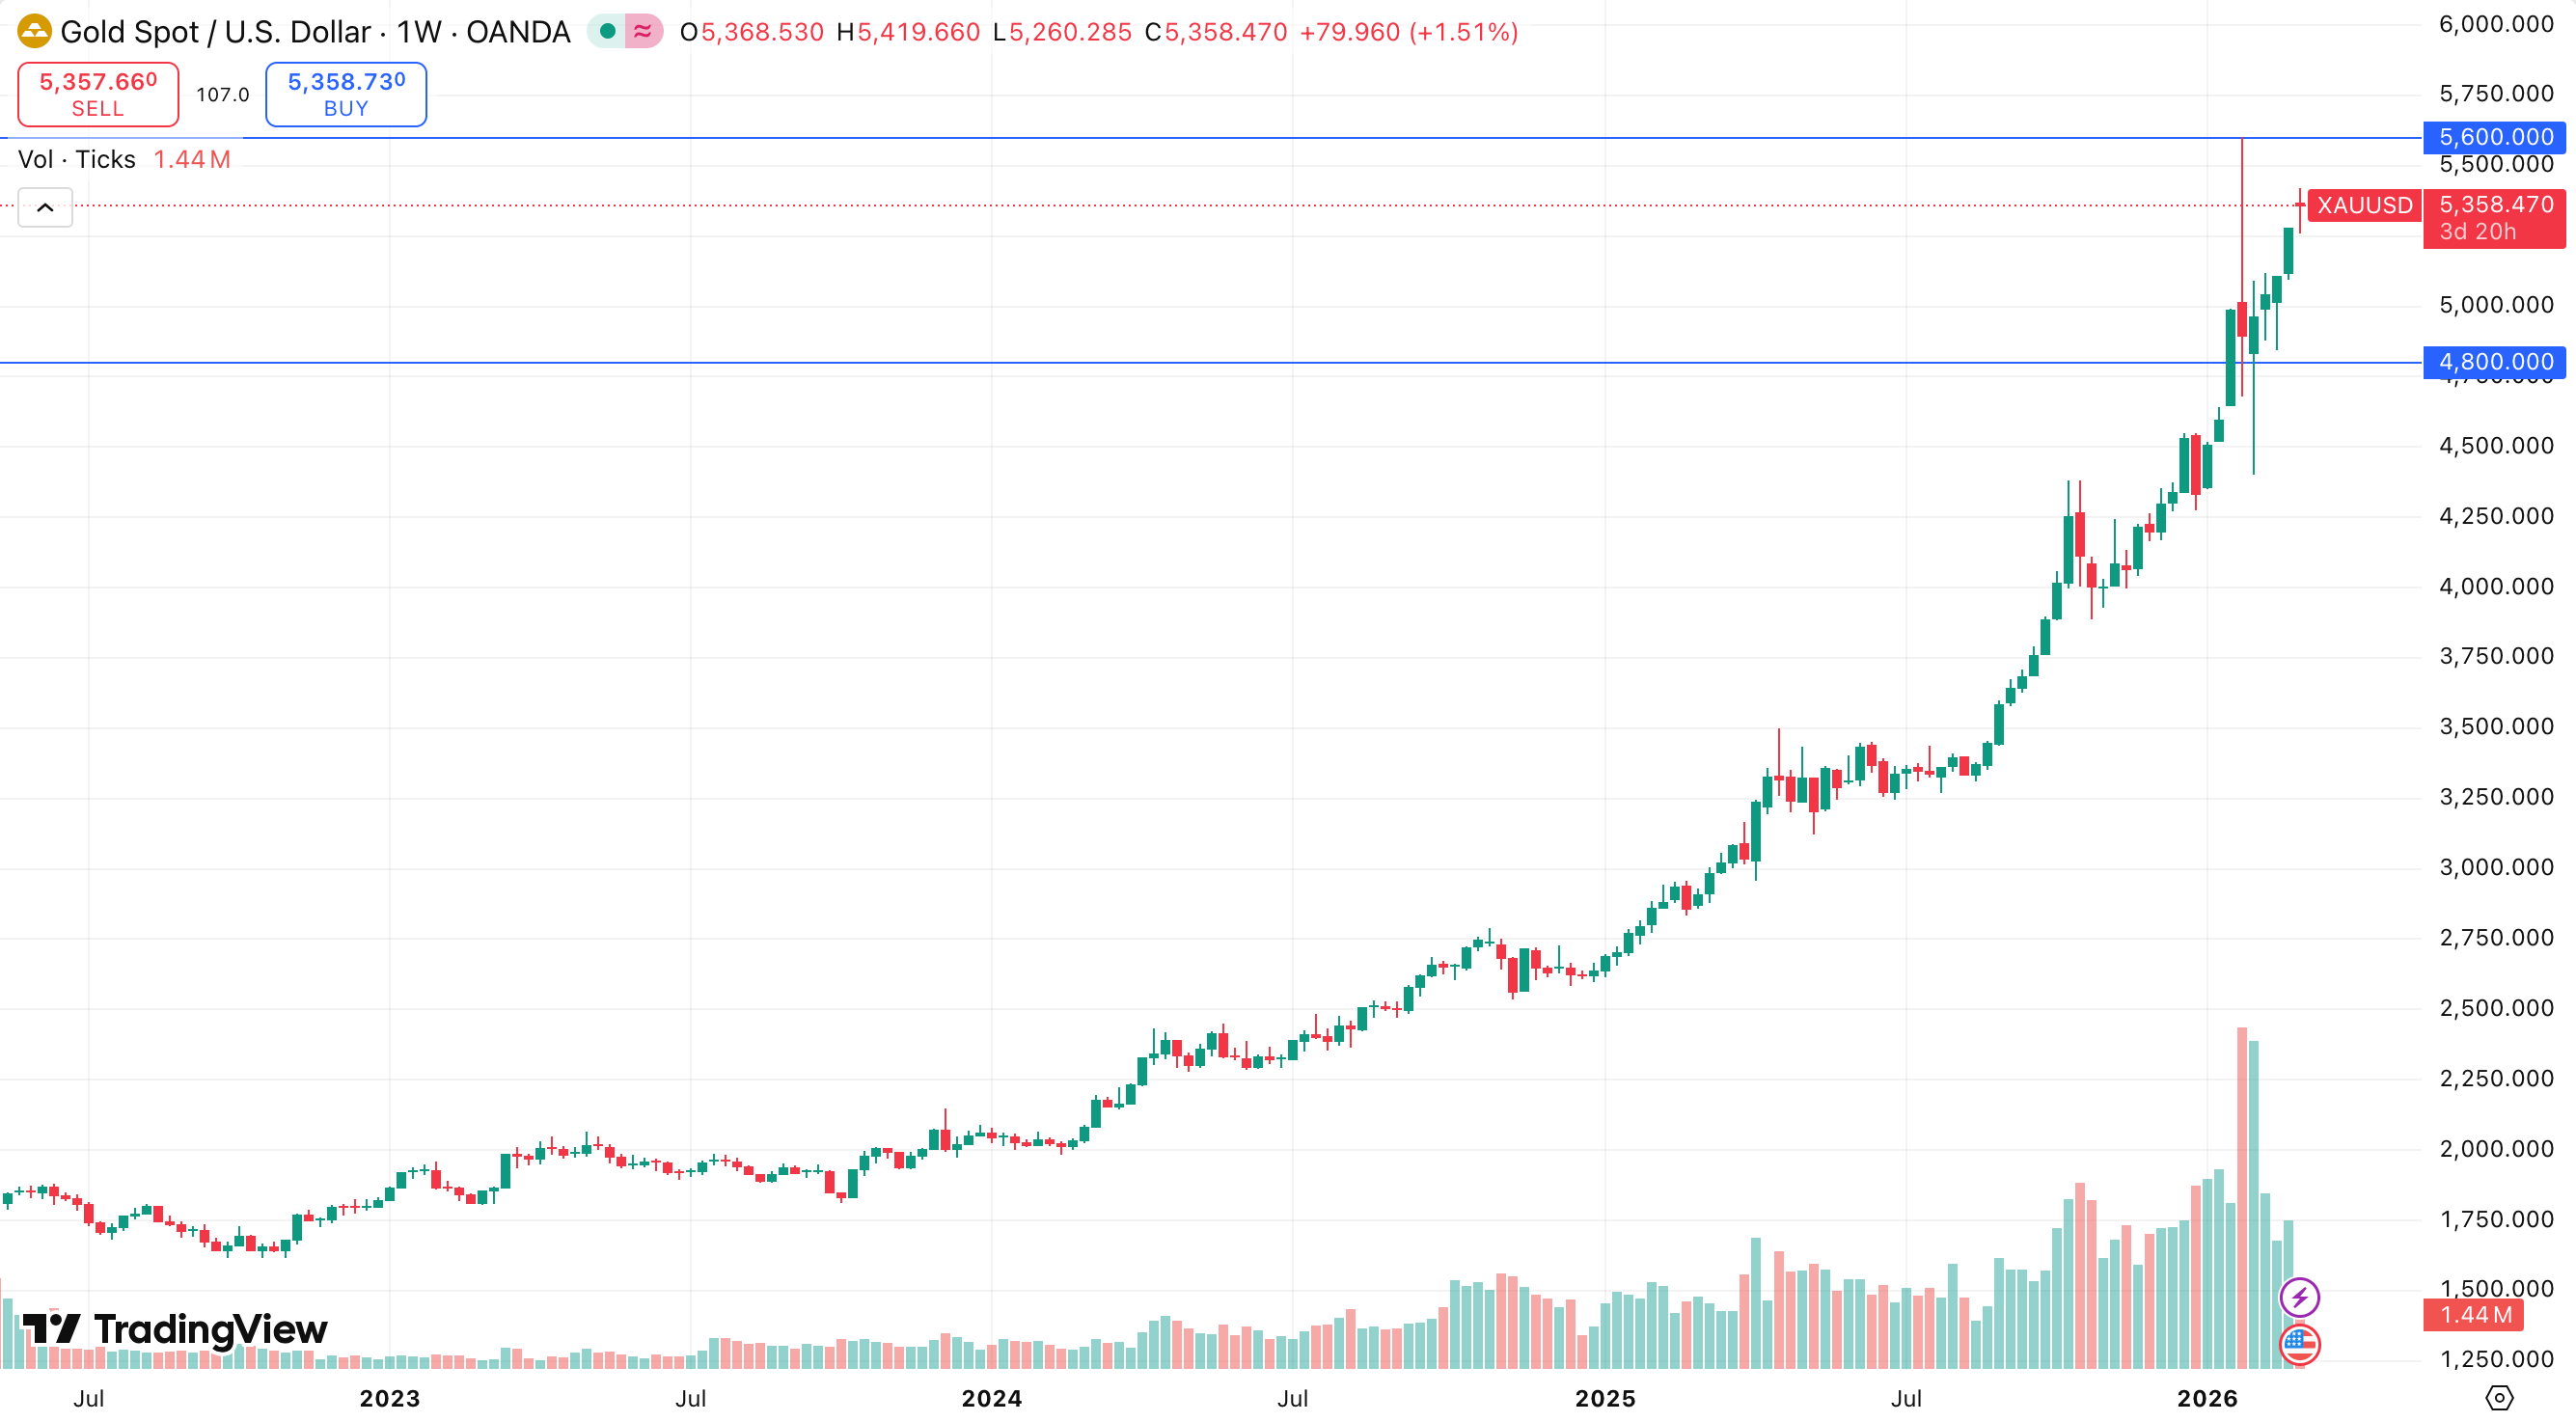
Since the start of 2024, gold has jumped +155% from its $2,050 base, reaching an all-time high of $5,608 in January 2026. In 2025 alone, the asset grew by 67%, marking the strongest annual performance in 47 years, a feat not seen since 1979. This acceleration has pushed gold into a state of price discovery, where technical resistance levels are practically absent.
Pillar 1: The Debasement Trade and Long-term Fiat Depreciation
The $300B freeze of Russian reserves in 2022 became the primary catalyst for a global re-evaluation of the safety of USD denominated assets. Central banks, particularly those within the BRICS+ alliance, began a systematic diversification into physical gold, which stands as the only asset without counterparty risk. According to the Central Bank Gold Reserves Survey, 81% of central banks expect further growth in gold reserves, and 28% plan to increase their holdings within the next 12 months.
Pillar 2: Real Rates and Monetary Conditions
With 10 year Treasuries yielding approximately 4.05% and core inflation at 2.7%, real rates are hovering around the 1.3–1.6% range. Historically, gold performs with exceptional strength when real rates remain below 2%. In a sustained environment of Quantitative Easing, gold serves as a critical hedge against hidden inflation.
Pillar 3: US Fiscal Crisis and the Debt Supercycle
Federal debt has now exceeded the $38.8T mark, and the budget deficit is running at over 6% of GDP, with $1.9T projected by the CBO for the 2026 fiscal year. Deep political polarisation prevents any serious attempt at fiscal consolidation. Investors increasingly understand that this debt will be eroded via inflation and nominal growth, which implies a fundamental, long term weakness for the USD.
Pillar 4: The Trump Factor and Geopolitical Turbulence
The current administration actively pursues a policy of USD weakening to bolster domestic exports. As a result, the DXY has lost 13% over the past year. Concurrent geopolitical tensions, ranging from issues involving Greenland and Venezuela to the broader Middle East, generate a continuous and robust demand for safe haven assets. Gold remains the traditional and ultimate safe haven in global financial markets.
Central Banks and Global Demand Structure
Central bank purchases remain the core engine of this rally. Following the record breaking 1,136t in 2022, the pace of accumulation stabilised at 1,044–1,051t annually. In the 2023–2024 period, this volume was 2.2x above the pre-crisis norm of 2010–2021, which averaged 473t per year.
2025 Statistics: Net known purchases reached 863t.
Third Quarter 2025 Data: Central banks bought 220t, which is 10% more year over year, and a significant 28% increase quarter over quarter despite the record high price environment.
Secondary Demand Drivers: The market saw record inflows into exchange traded funds of 801t and physical bar and coin demand reaching 1,374t.
Total Volume: Total global demand in 2025 exceeded 5,000t, valued at approximately $555B, an increase of 45% year over year.
Silver 2024–2026: Fundamental Drivers and Market Volatility
Silver has experienced its own powerful growth cycle in recent years. In 2025, silver prices surged by approximately 147%, reaching record levels above $120/oz amidst supply deficits and macro economic drivers. By early 2026, silver continues to show strong growth, outpacing gold in annual percentage terms with a 30% increase year to date.
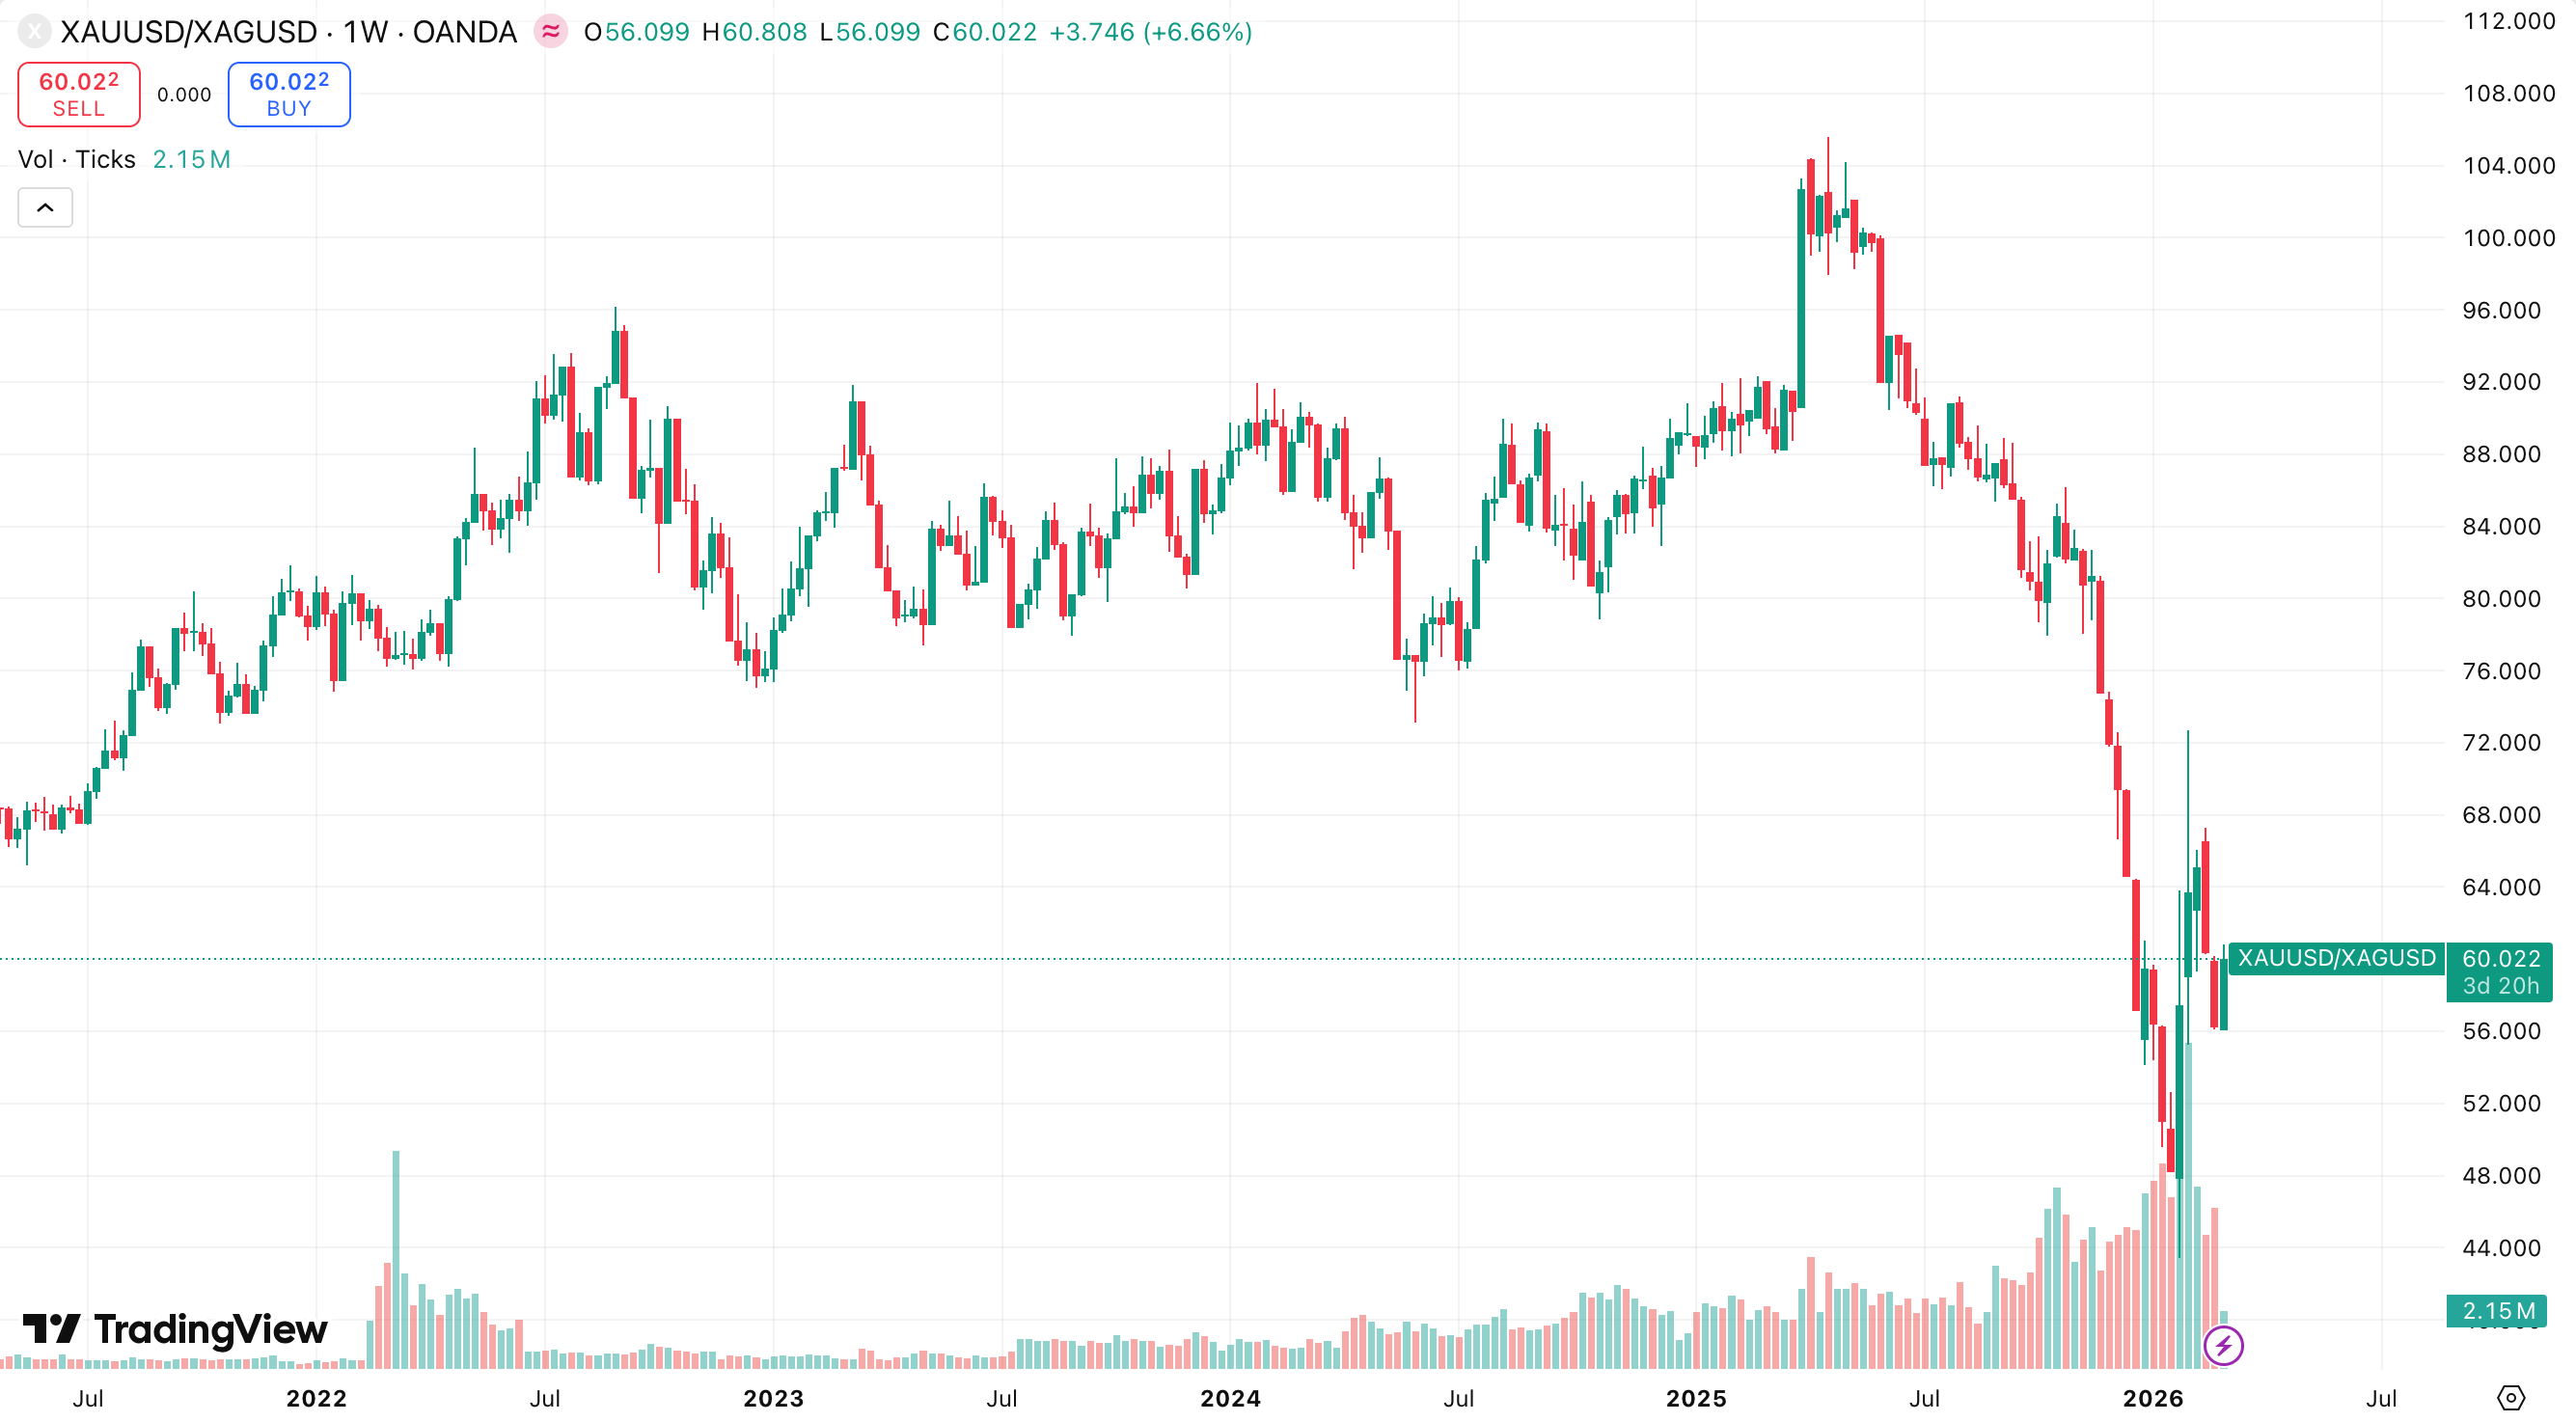
The market, however, remains highly volatile, with large swings and drops of over 30% in short periods being a notable feature of the 2026 landscape.
Key Fundamental Drivers for Silver
Structural Supply Deficit: Silver has been in a supply deficit for several consecutive years, with demand significantly exceeding available supply. The Silver Institute estimates that deficits may reach tens of millions of ounces in 2026. Producкtion growth is inherently limited to 1% or 2% per year, as most silver is produced as a byproduct of other metals like gold and copper, making rapid expansion nearly impossible.
Industrial Demand Growth: Silver properties of conductivity and reflectivity make it essential for electronics, sensors, artificial intelligence data centers, solar panels, and the electric vehicle industry. The solar sector alone consumes hundreds of millions of ounces annually. Unlike gold, 50–60% of silver demand is industrial, adding a long term structural factor to its price.
Macro and Safe Haven Demand: Like gold, silver is viewed as a hedge during trade wars, geopolitical tensions, and periods of rate cut expectations. For example, in February 2026, silver exchange traded funds and futures surged in direct response to rising trade and geopolitical risks.
Demand Structure: Investment demand remains strong with inflows into silver exchange traded funds, particularly during market turbulence. Physical demand for coins and bars remains solid into 2026 despite the high price environment.
Tokenised Silver as the New Player
Representing physical silver in the form of real world assets tradable on blockchain exchanges, tokenised silver offers significant advantages:
Fractional ownership down to 1g or 1oz.
24/7 trading with higher liquidity than physical silver.
Usability in decentralised finance and smart contracts.
Scenarios, Outlook, and Monitoring 2026–2027
Gold Price Framework
Base Case with 65% Probability: Consolidation between $4,800 and $5,600 with a gradual move to new highs of $5,700 to $6,300 by late 2026. Central bank and institutional demand is expected to fully offset weakness in the jewelry segment.
Bull Case with 25% Probability: A geopolitical shock or US recession could drive prices toward $6,300 to $7,500 by 2026–2027.
Bear Case with 10% Probability: A stronger USD, combined with sharp Federal Reserve tightening and trade war de-escalation, could lead to a correction toward $4,300 to $4,800.
Short term period of 1 to 3 months expects volatility of ±10% with support at $4,700 to $4,800 and resistance at $5,300 to $5,500. The mid term period of 6 to 18 months outlook remains a confident uptrend with targets of $5,900 to $6,500 by the end of 2026 and $6,800 to $7,800 in 2027.
Silver Price Framework
Base Case with 60% to 70% Probability: Consolidation around current levels with a gradual move to new highs. Support is found at $70 to $90/oz, with resistance at $100 to $120.
Bull Case with 20% to 30% Probability: Geopolitical stress or a sharp USD drop could push silver to $150 and above in 2026–2027.
Bear Case with 10% Probability: Real rate hikes and risk on sentiment could lead to a pullback toward $45 to $60/oz.
Conclusion: Navigating the Supercycle
In conclusion, the data confirms that gold and silver are no longer just cyclical commodities but have become central to a regime driven monetary reset.
The combination of inelastic supply, particularly in the silver market, and an insatiable demand from the official sector creates a unique environment of allocation driven acceleration. While short term volatility is inevitable, the long term trajectory is underpinned by a historic debt supercycle and the irreversible diversification of global sovereign wealth.
For the discerning investor, the years 2024–2026 represent a generational opportunity to secure value in an era of long term fiat depreciation.