📊 Market Overview
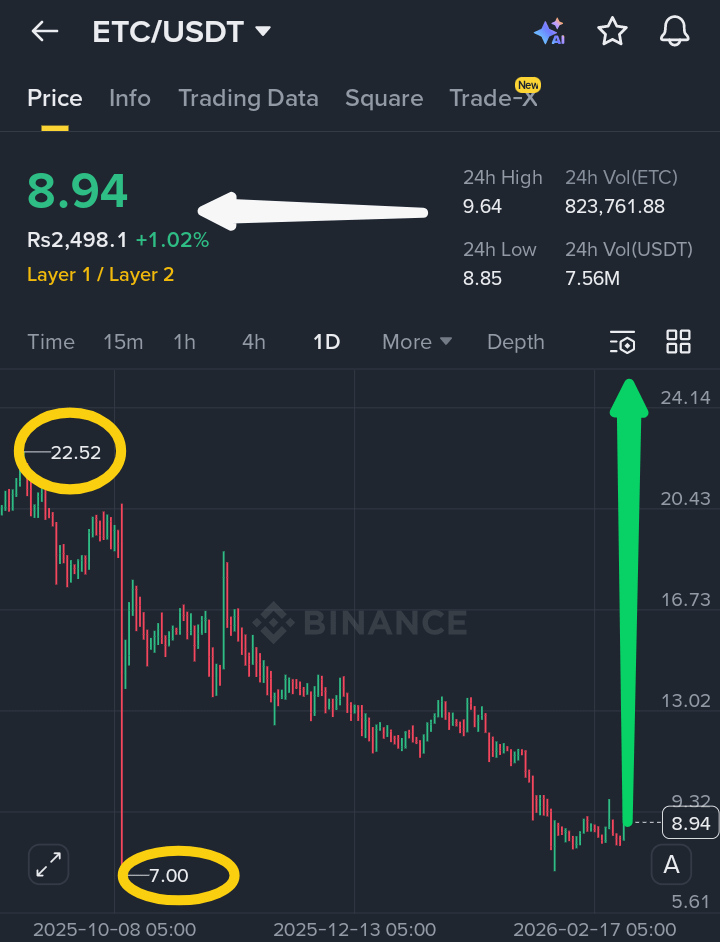
$ETC is currently trading near $8.94 after a prolonged macro decline from the $22.50 region. The structure reflects sustained lower highs and lower lows, confirming a dominant bearish trend over recent months. The sharp historical flush toward $7.00 marked a capitulation wick, suggesting forced liquidations rather than controlled distribution. Price is now hovering near a historically reactive demand zone.
📉 Technical Structure
On higher timeframes, $ETC remains inside a descending channel with repeated rejection at dynamic resistance levels. RSI has spent extended periods near oversold territory, reflecting weak bullish momentum but also signaling reduced aggressive selling pressure. Volume spikes occurred primarily during downside moves, indicating panic-driven exits. Immediate support sits at $8.50–$9.00, while $10.50–$11.00 is the key resistance needed to shift structure toward recovery.
📈 Strategic Outlook
$ETC Deep corrections exceeding 60% often push assets into value-based accumulation zones where long-term participants begin positioning. While macro structure remains bearish, downside momentum is slowing near support. A confirmed breakout above $11.00 with strong volume could initiate a relief rally toward $13–$14. Until confirmation appears, disciplined accumulation near support with strict risk management remains the calculated approach.
#ETC #EthereumClassic #CryptoAnalysis #altcoins #BinanceSquare