 The $BTC chart is sending mixed signals as we hover near a critical decision zone. According to current market logic, we are facing a "make or break" moment that could define the trend for the rest of February. 📅
🔍 The Bearish Case: The "Discount" Leg
If Bitcoin fails to hold the immediate support and breaks cleanly through $63,248.70, we could be looking at a significant "discount" event. A break here likely triggers a new leg down, as stop-losses get hunted and liquidity is sought at much lower price levels. 📉
⚖️ The Bullish Case: Seller Exhaustion
However, looking at the daily timeframe, this current price action might just be a strategic move by sellers to flush out weak hands and attract a fresh batch of buyers. 🛑 If this level is defended, it confirms that institutional interest is still strong despite the recent "February Slide."
Key Takeaway: The market is currently a battleground.
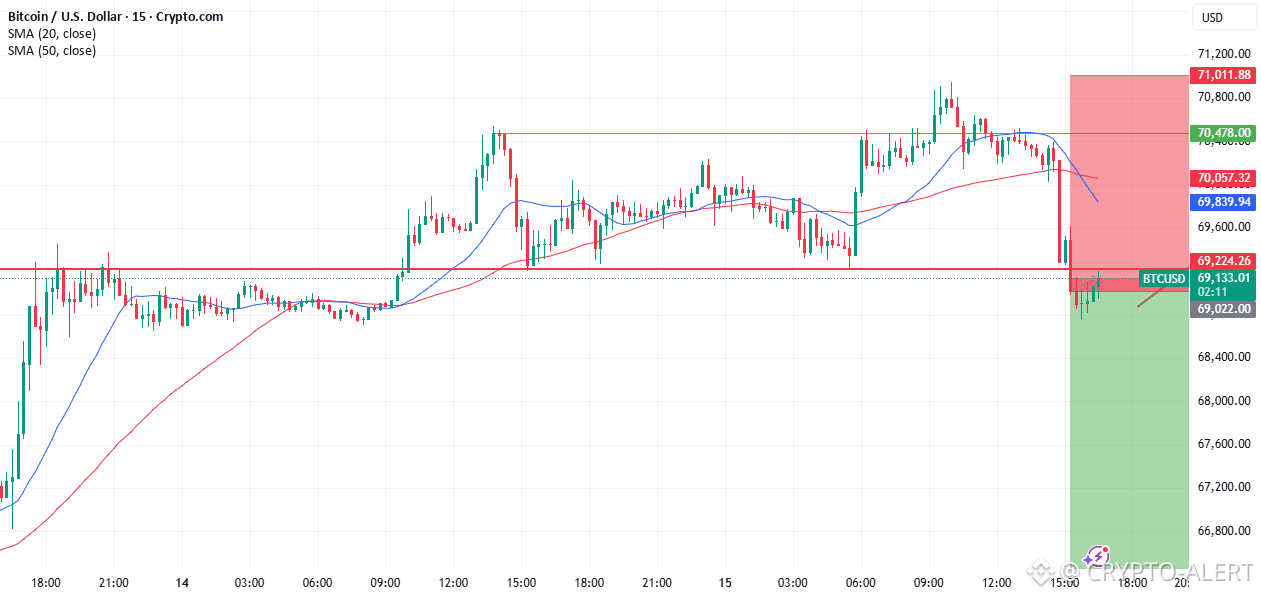
Support to Watch: $63,248 🛡️
Resistance to Reclaim: $70,000 🎯
Liquidity is the name of the game. Are the bears setting a trap, or are the bulls preparing for a massive bounce? 🐂🐻
Stay disciplined and watch the volume! 📊
