Bitcoin (BTCUSD) is having a unique correlation historically with the 0.382 Fibonacci retracement level, both on uptrends and downtrends. This is of critical importance right now, at this part of the Bear Cycle we are currently at and we will explain to you why.
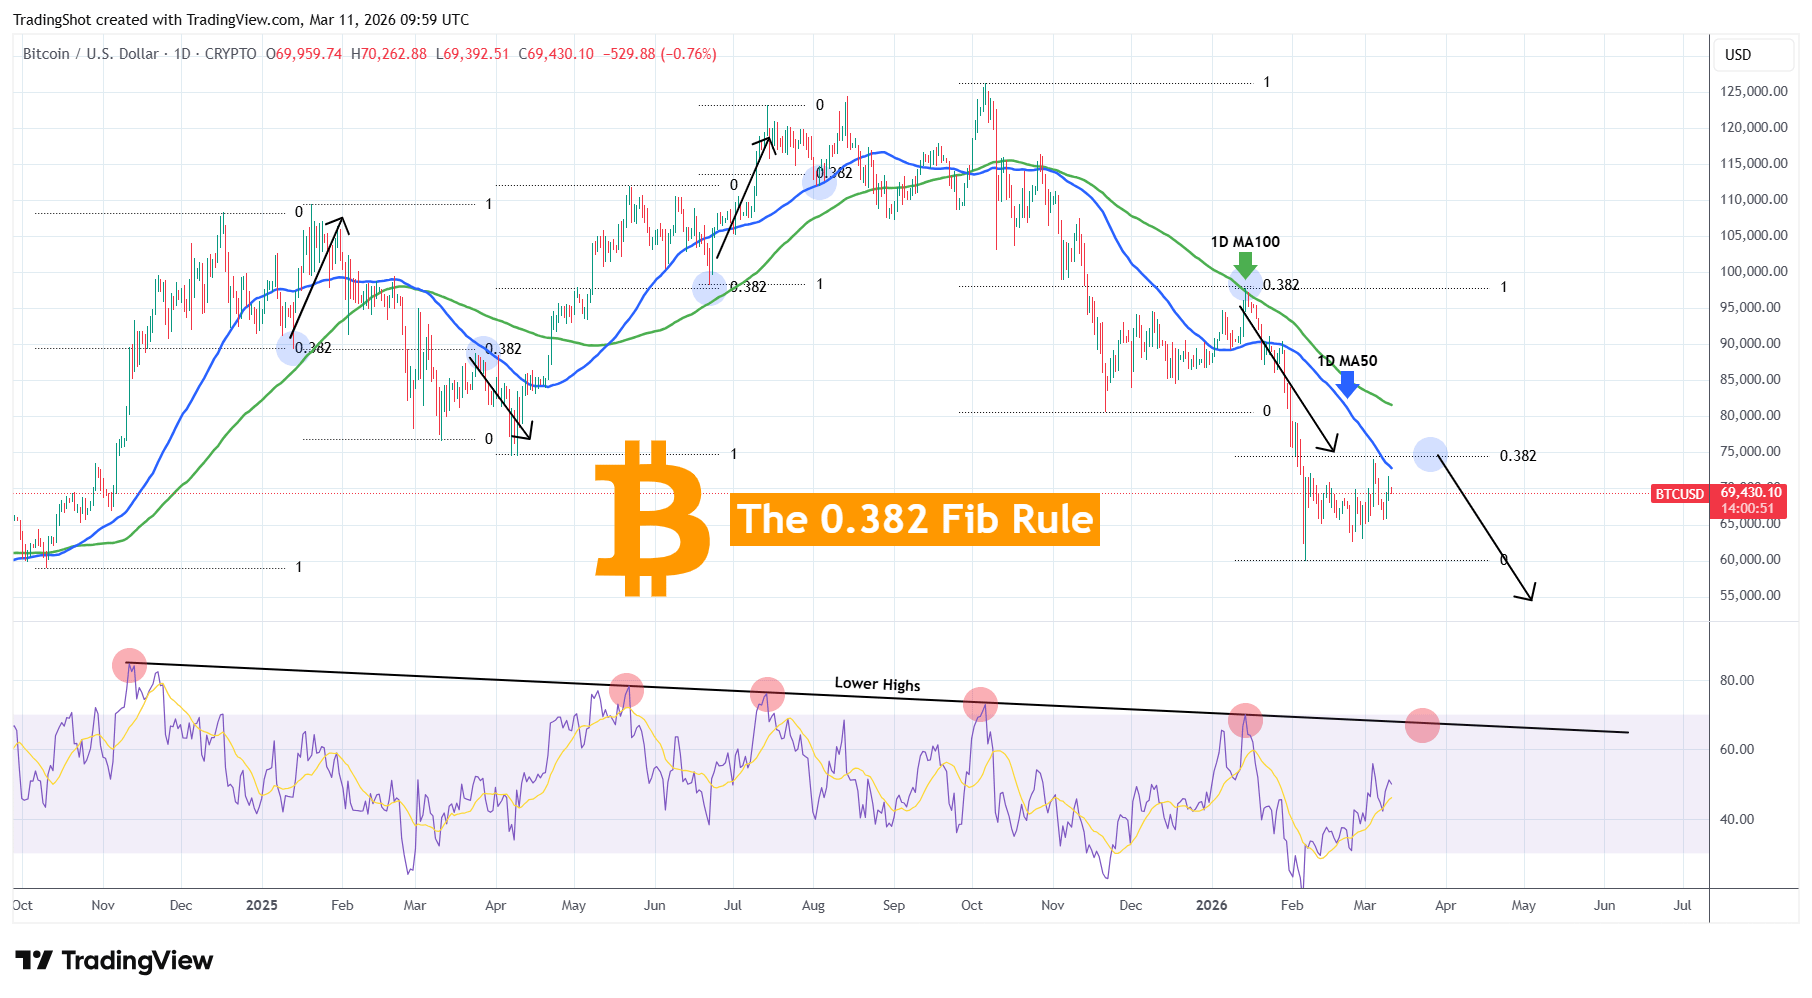
To get a better understanding of this connection, on today's analysis we take a long price action sample since October 2024. As you can see, every trend BTC had since then that pulled-back to its 0.382 Fib, it held it either as Support (during Bullish Legs/ rallies) or Resistance (during Bearish Legs/ corrections) and then continued the dominant trend.
Even since the star of the current Bear Cycle we are seeing this with the market already making a January 14 2026 rebound on the 0.382 and getting rejected to a new Bearish Leg. That rejection was also on the 1D MA100 (green trend-line), which is currently serving as the Bear Cycle's medium-term Resistance.
Since the price has already almost touched the 0.382 Fib last Wednesday, we give it a maximum tolerance extension to continue sideways for the rest of the month (at best) and get close to the 1D MA100 again for a new rejection. That could actually coincide with the 1D RSI testing its 1.5 year Lower Highs trend-line. Whether the rejection takes place now or around the end of March, the long-term trend remains heavily bearish and the Cycle's bottom isn't yet in.
Please LIKE 👍, FOLLOW ✅, SHARE 🙌 and COMMENT ✍ if you enjoy this idea!