
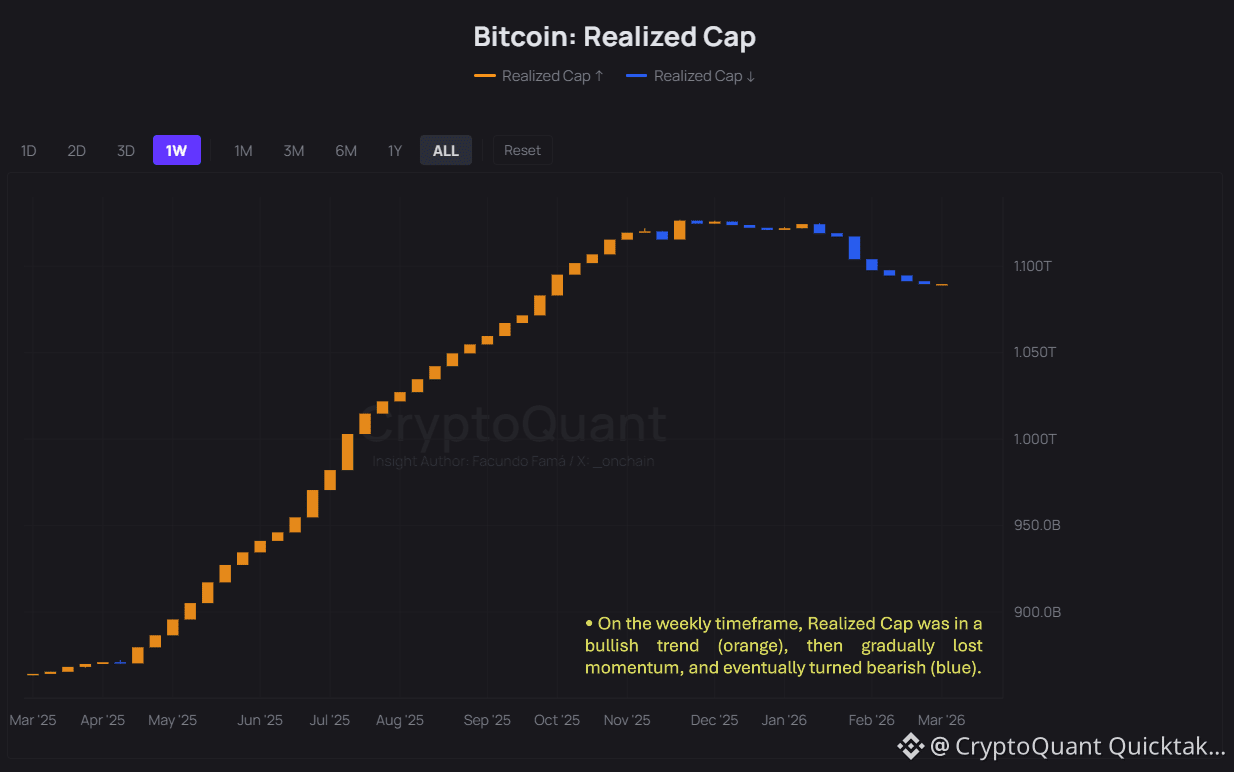
• First and foremost, Japanese candlesticks are a visual tool for organizing time series data into OHLC format (Open, High, Low, and Close) across different timeframes. Under this definition, their application is not limited to price. They can also be used to represent other time series, including on-chain metrics.
• Insight: On the weekly timeframe, Realized Cap was in a bullish trend (orange), then gradually lost momentum, and eventually turned bearish (blue).
• If you'd like to learn more about the history of Japanese candlesticks, check the link below.
Written by _OnChain