
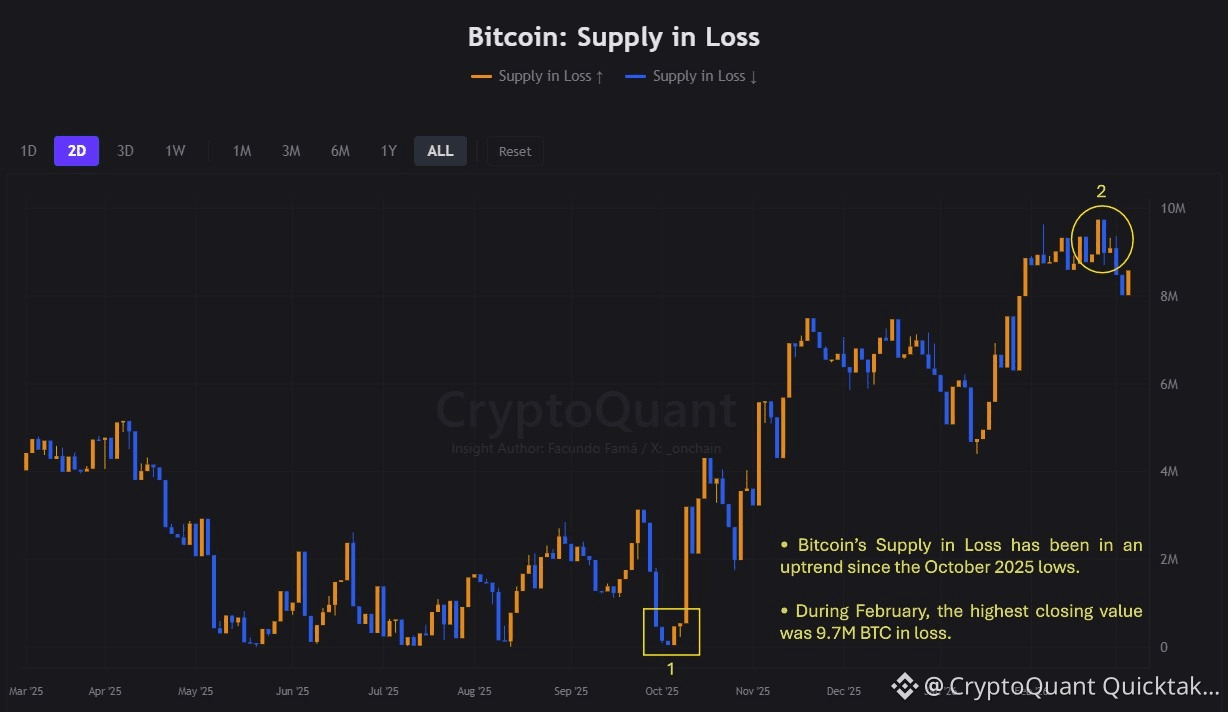
• First and foremost, Japanese candlesticks are a visual tool for organizing time series data into OHLC format (Open, High, Low, and Close) across different timeframes. Under this definition, their application is not limited to price. They can also be used to represent other time series, including on-chain metrics.
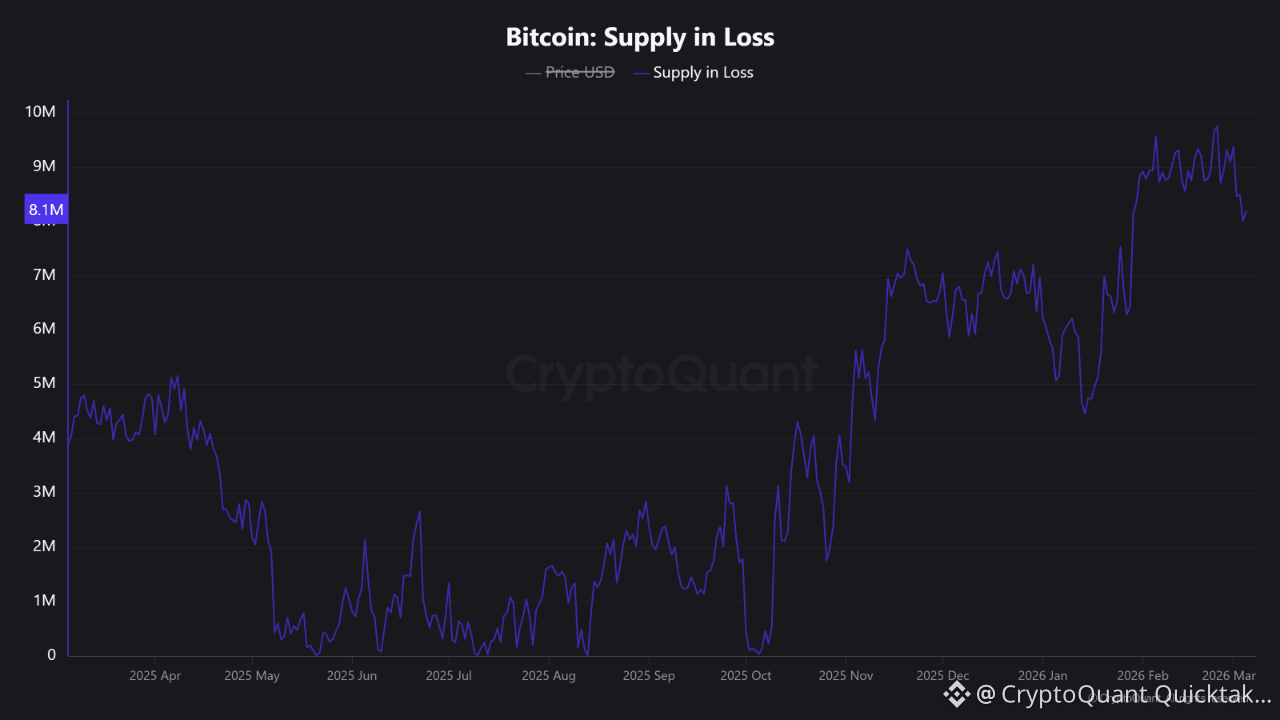
• Insight: Bitcoin’s Supply in Loss has been in an uptrend since the October 2025 lows. During February, the highest closing value was 9.7M BTC in loss.
• If you'd like to learn more about the history of Japanese candlesticks, check the link below.
Written by _OnChain