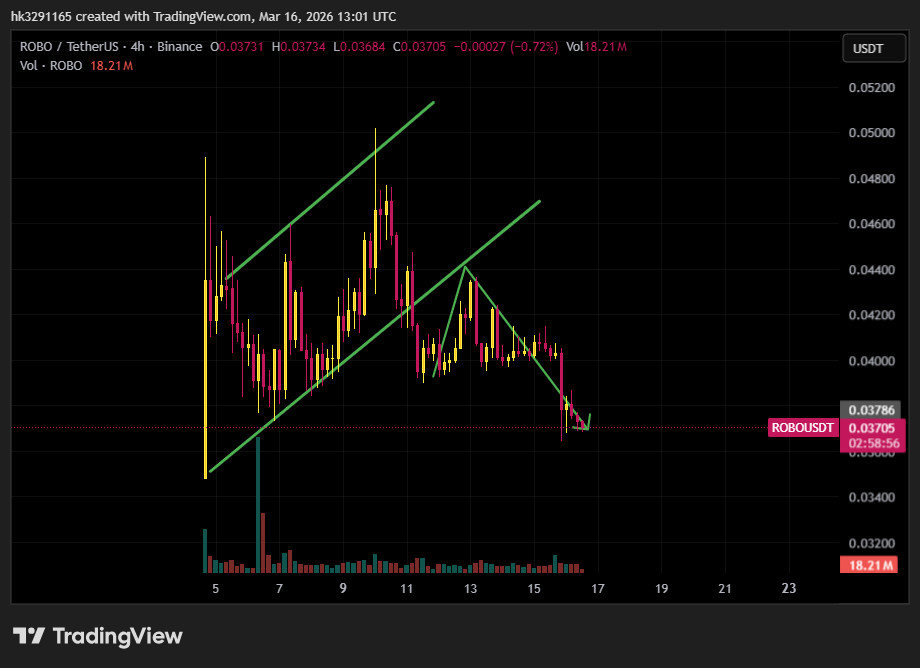
The ROBO/USDT pair recently showed a strong upward movement within an ascending channel. During this phase, the price respected both the upper and lower trendlines, forming higher highs and higher lows. This structure indicated a bullish market where buyers controlled the momentum.
However, after reaching the upper area near the 0.047–0.048 level, the price started to lose strength. The market failed to continue making higher highs and eventually broke below the lower boundary of the ascending channel. This breakdown signaled a potential trend reversal and suggested that buying pressure was weakening.
Following the channel breakdown, the market formed a short-term consolidation pattern that resembled a descending triangle. This pattern is typically considered bearish, as it shows sellers gradually pushing the price lower while support remains fixed. Eventually, the support level around 0.040 was broken, confirming the bearish continuation and causing the price to drop toward the 0.037 region.
At the moment, the 0.036–0.037 zone is acting as a key support level. If this support holds, the market could experience a short-term bounce toward resistance levels near 0.040 and possibly 0.042. However, if the support fails to hold, the next potential downside targets could be around 0.034 and 0.032.
Overall, the short-term structure of ROBO/USDT appears bearish after the breakdown from both the ascending channel and the triangle pattern. Traders should watch the current support carefully, as the next major move will likely depend on whether buyers can defend the 0.036–0.037 level or if sellers push the price lower.
$ROBO @Fabric Foundation #ROBO