1. Market Overview
has experienced a sharp expansion in volatility, with price rallying more than 50% intraday and currently trading near $0.0156. The move follows a prolonged downtrend and appears to be driven by aggressive spot buying and short-side liquidations. The market environment has shifted from accumulation to momentum expansion, but the rapid price increase suggests the market may now enter a consolidation phase before the next directional move.
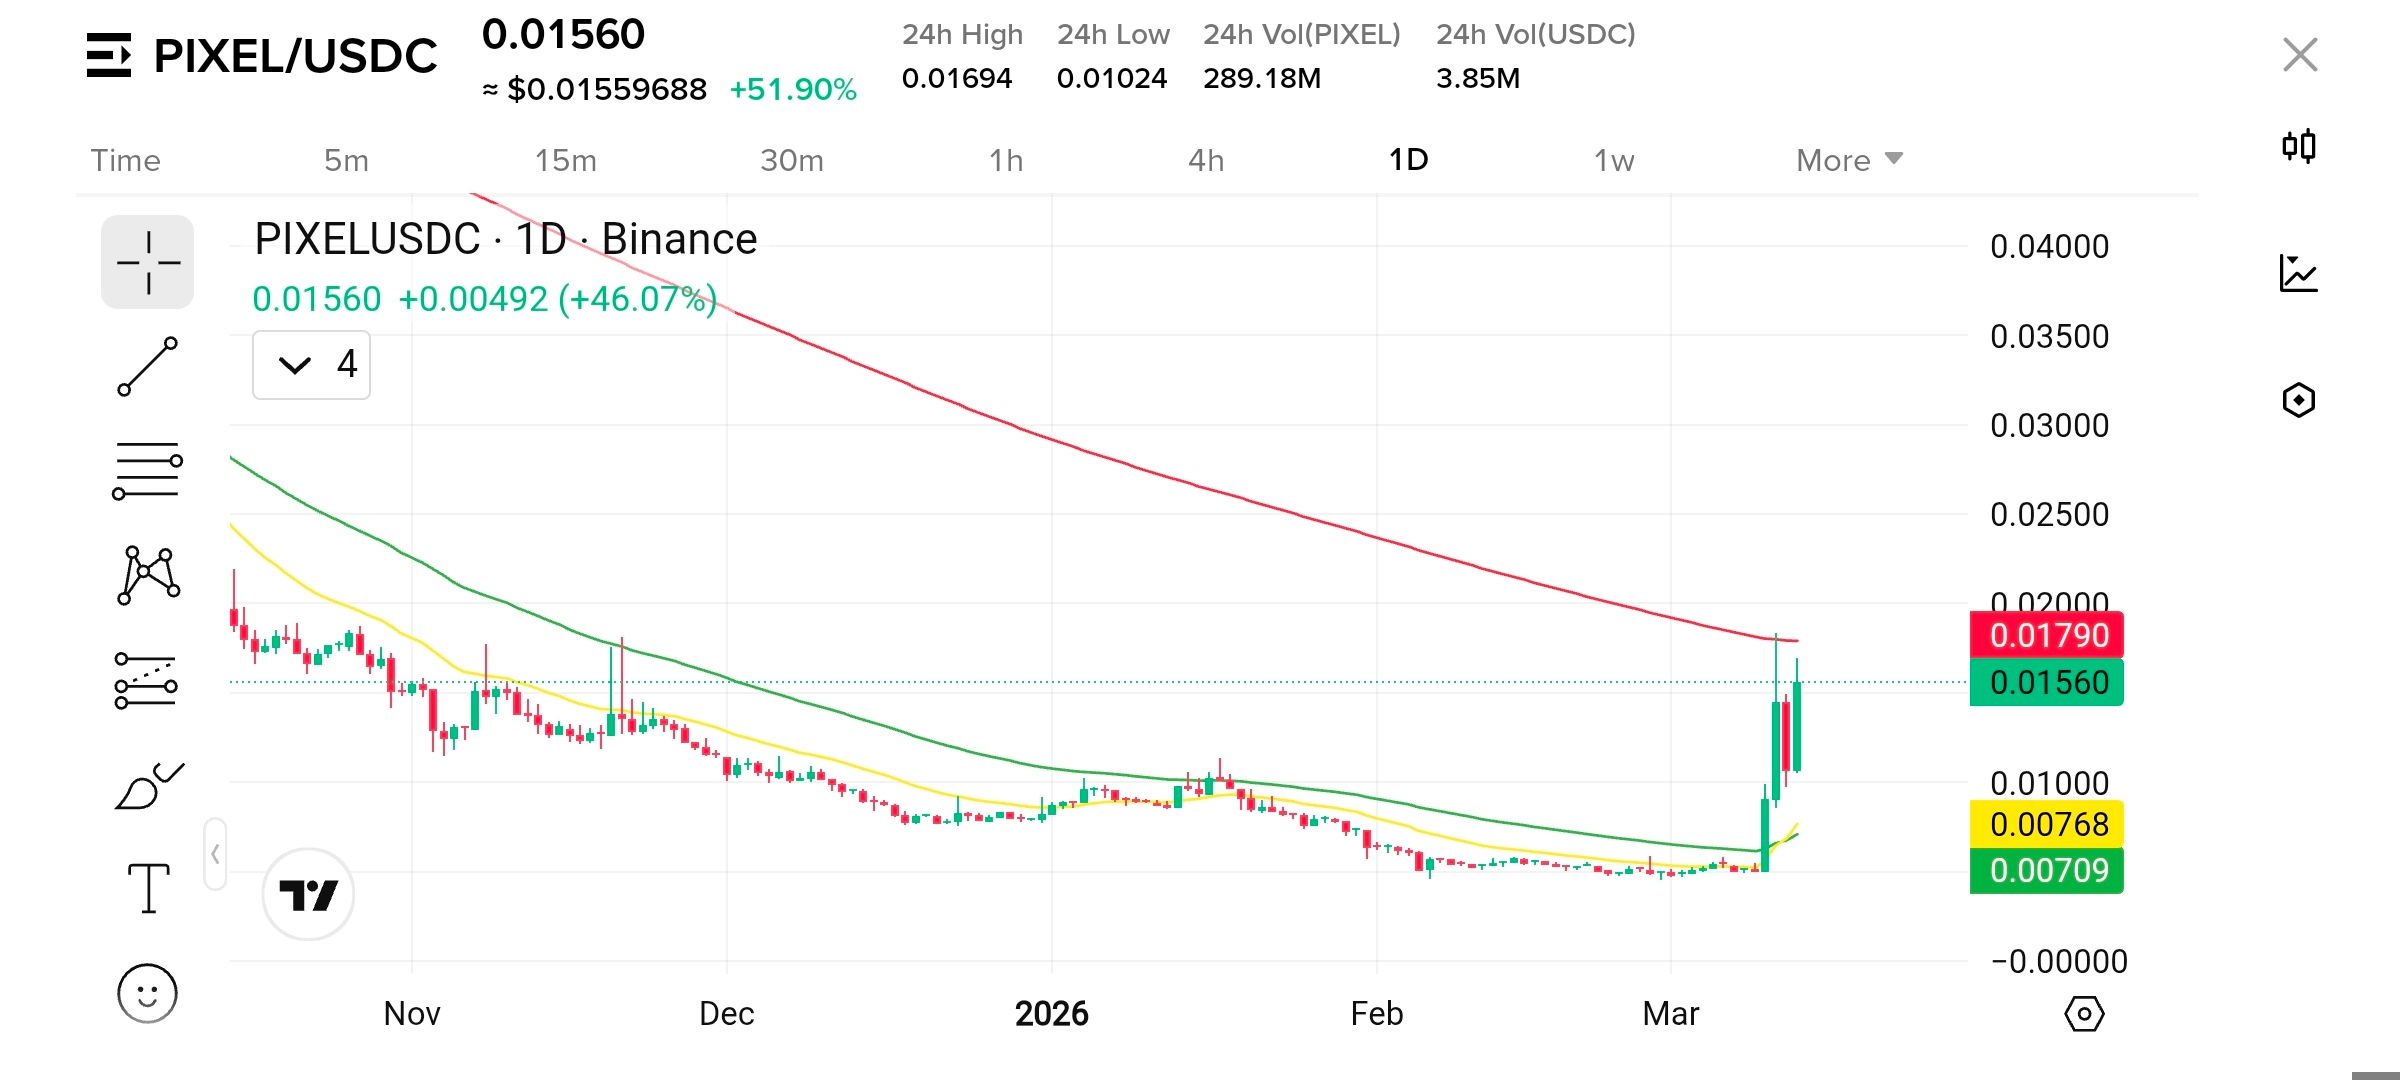
2. 1D Timeframe Analysis
On the daily timeframe, PIXEL recently broke out from a multi-month downtrend that persisted from late 2025 into early 2026.
Trend structure
The previous pattern consisted of lower highs and lower lows.
The recent rally represents the first strong bullish impulse, potentially forming a macro higher low.
Key levels
Major resistance: $0.0178 – $0.0200 (daily supply and long-term moving average zone)
Immediate support: $0.0120 – $0.0105
Structural support: $0.0070
If price holds above $0.012, the breakout structure remains technically intact.
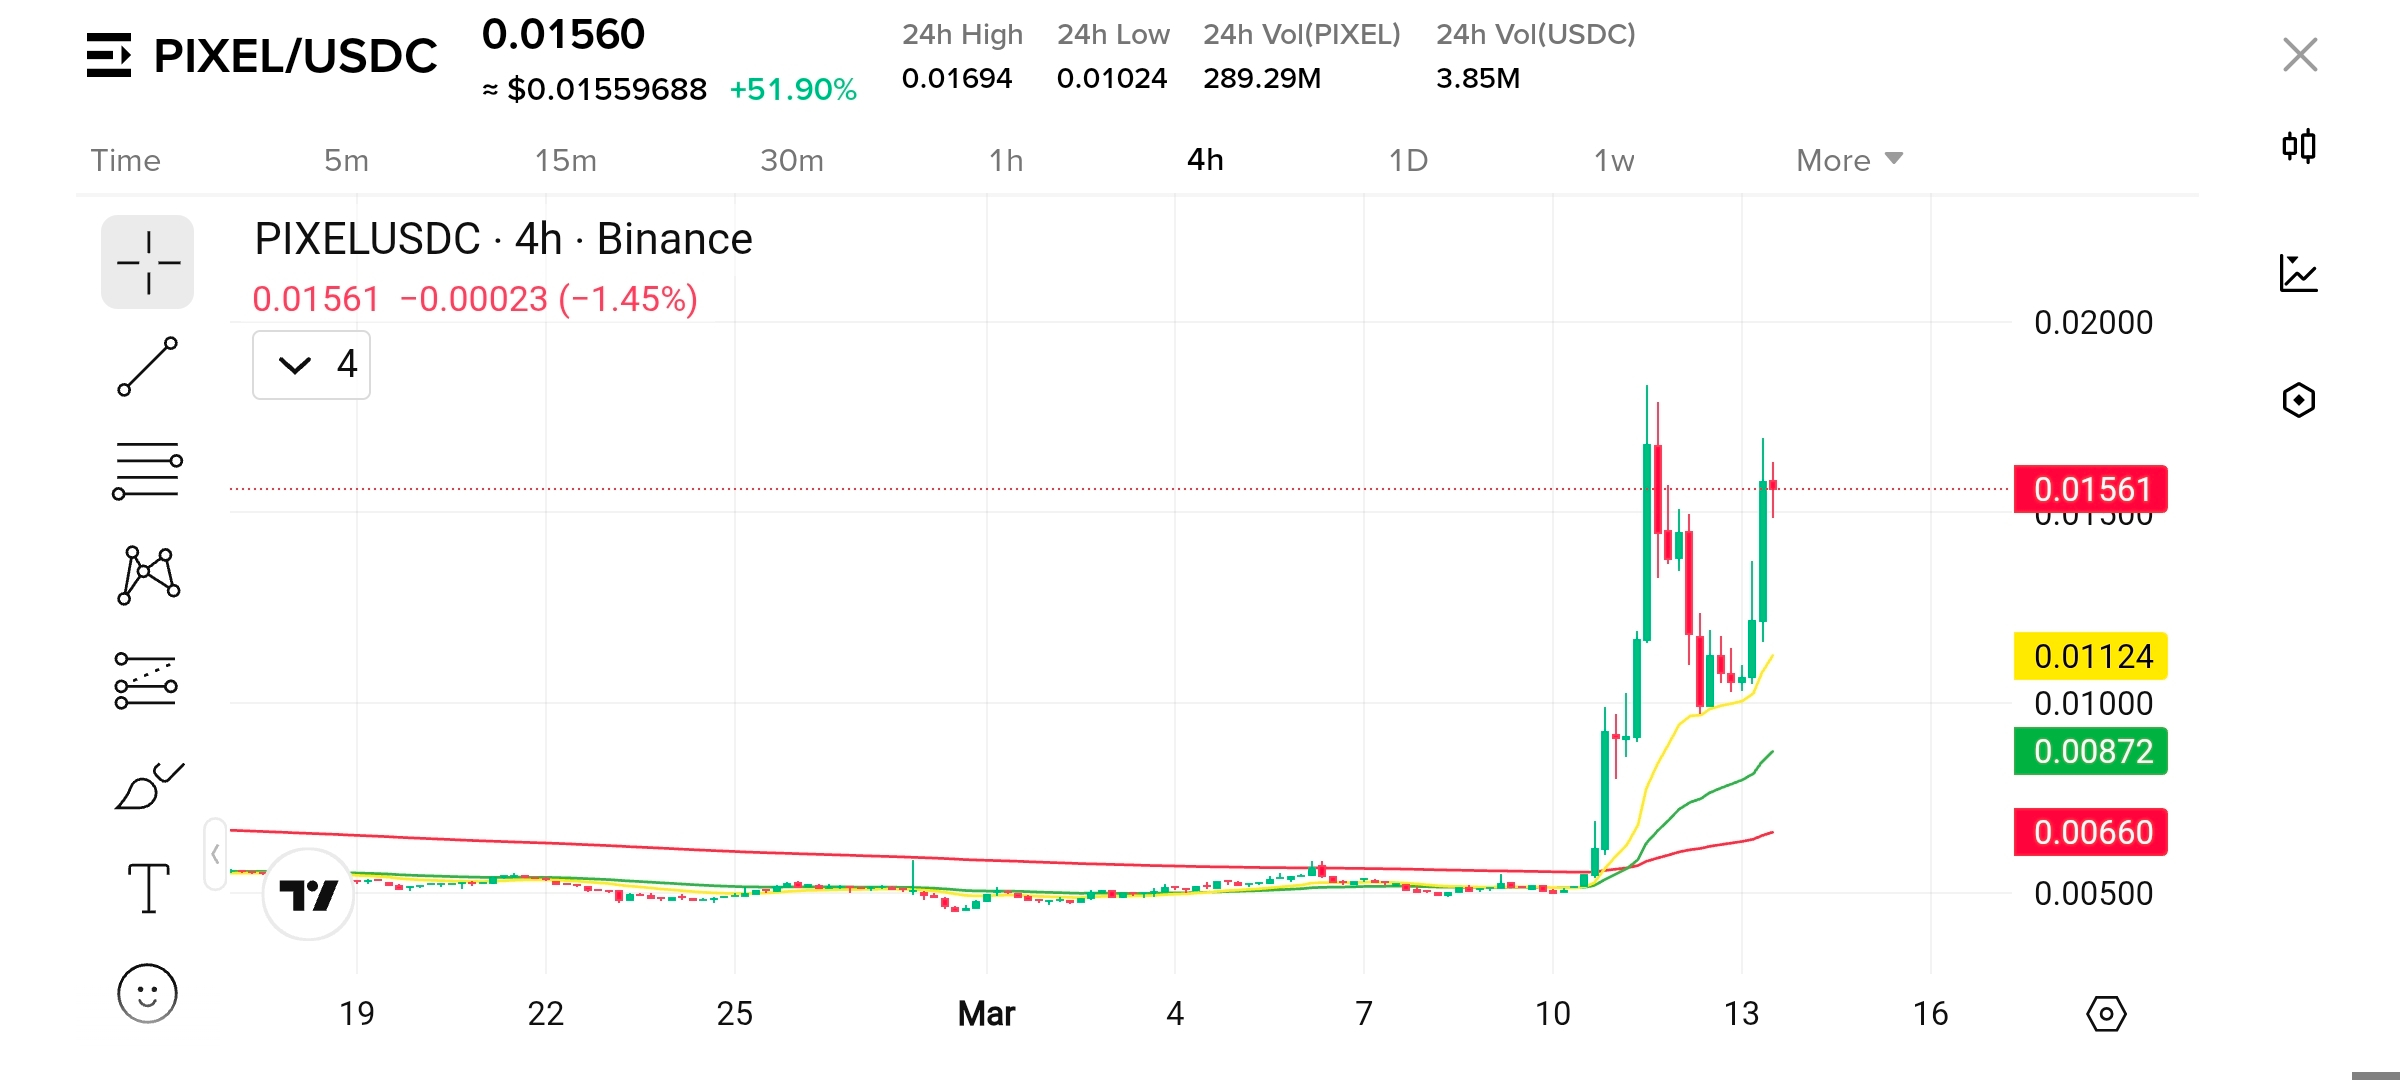
3. 4H Timeframe Analysis
The 4-hour chart shows a strong momentum breakout.
Observations:
Price broke above the 200-period moving average, confirming a shift in intermediate trend.
The rally created a vertical impulse move, followed by a quick retracement and continuation.
Current structure suggests a bullish continuation pattern, with consolidation occurring between:
Support: $0.0140 – $0.0130
Resistance: $0.0165 – $0.0175
A break above the upper boundary would likely trigger another momentum leg.
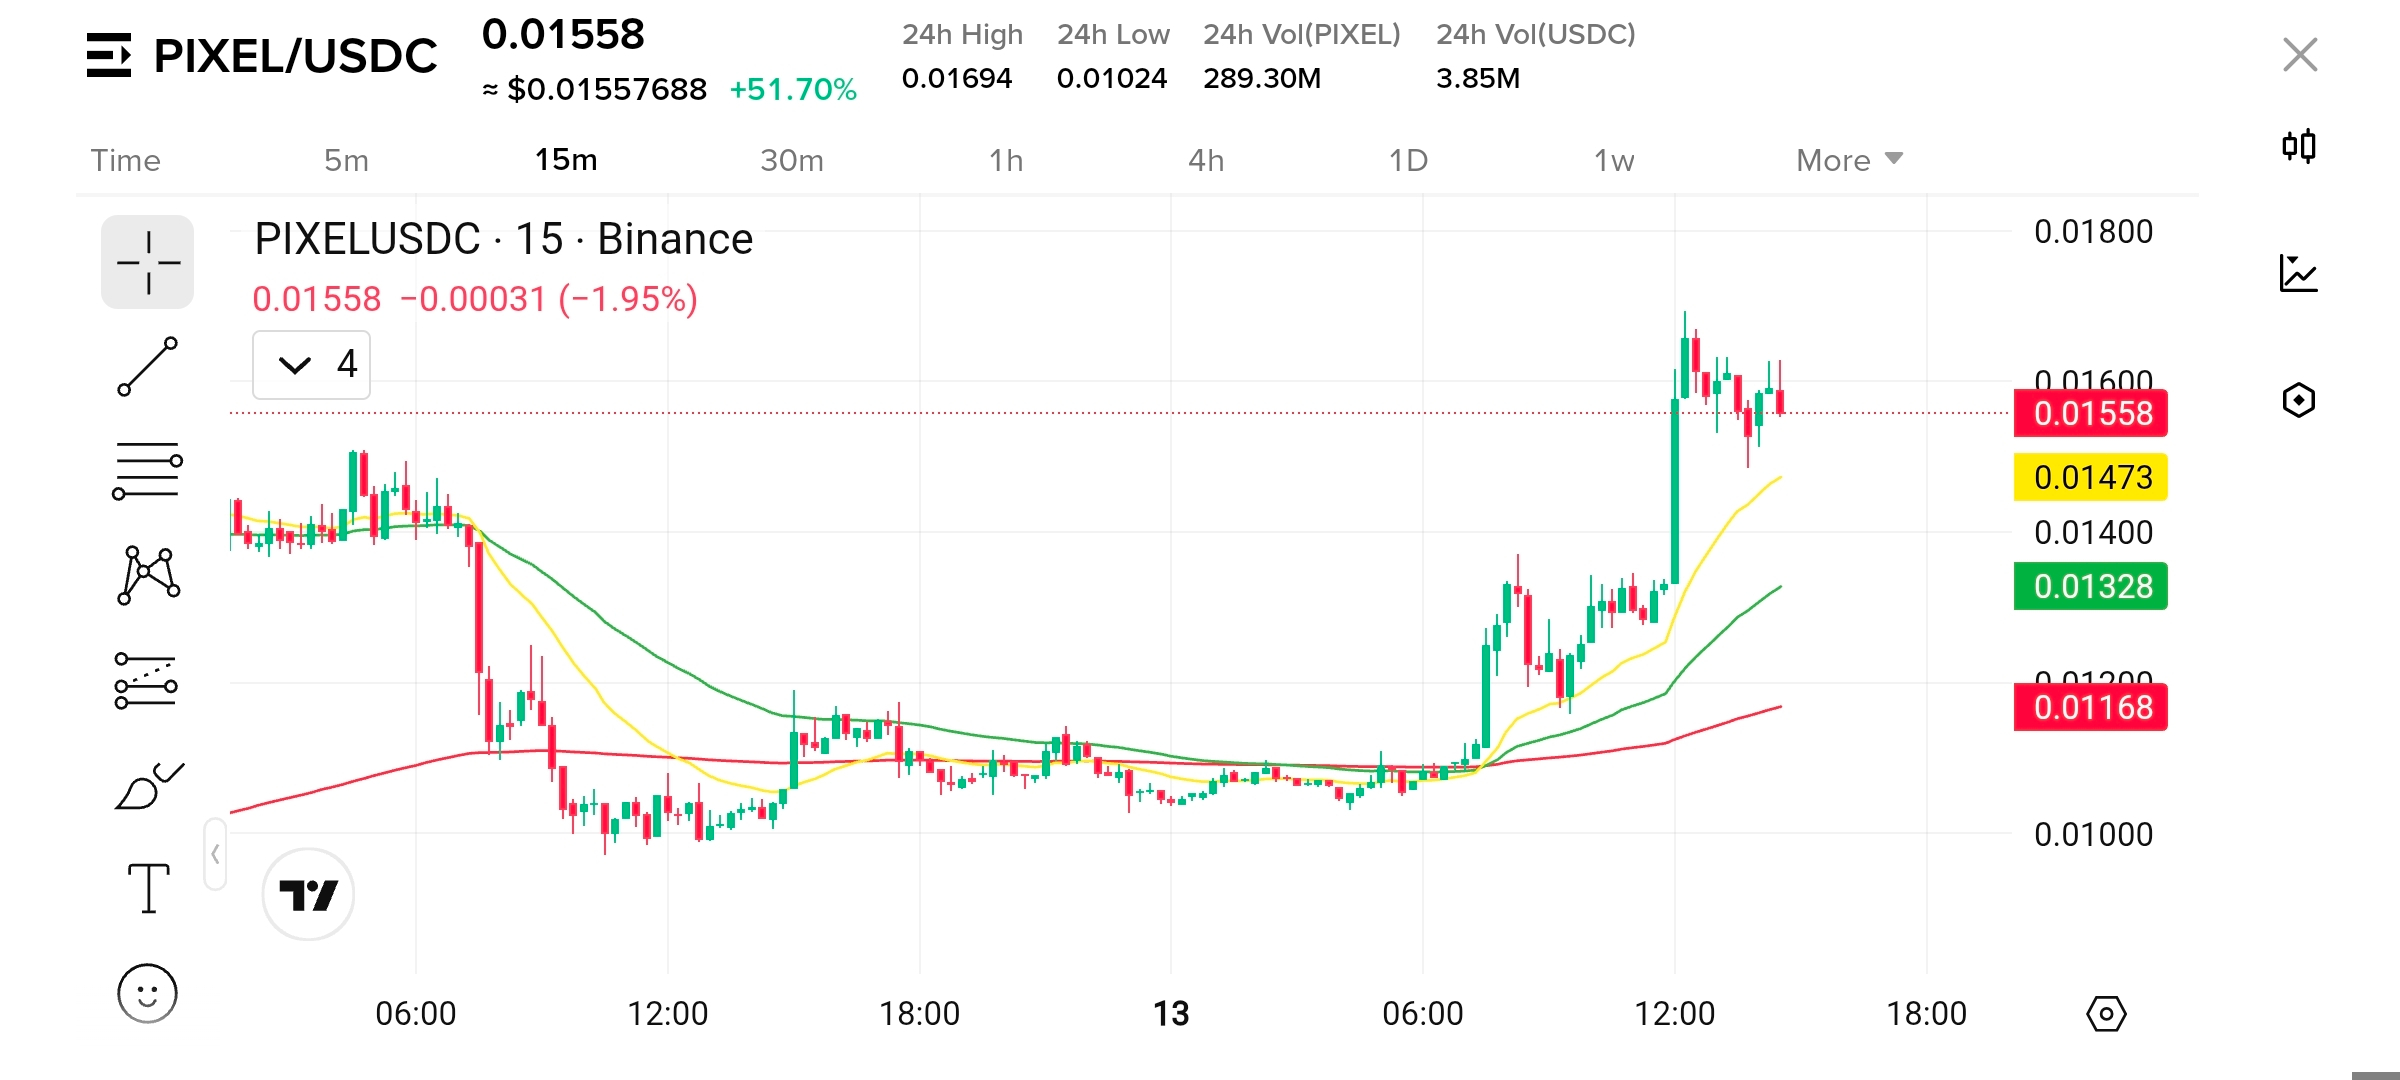
4. 15M Timeframe Analysis
The 15-minute timeframe shows post-breakout consolidation.
Structure:
Short-term range forming between $0.0152 and $0.0162.
Moving averages are stacked bullishly, indicating intraday trend strength.
Intraday levels:
Immediate support: $0.0150
Micro liquidity: $0.0147
Short-term resistance: $0.0163 – $0.0169
Scalping opportunities are likely to remain within this range until a clear breakout occurs.
5. Liquidity Heatmap Analysis
Based on recent volatility, liquidity is likely concentrated around:
Above price
$0.0168 – $0.0175 (short liquidation cluster)
Below price
$0.0145 – $0.0140 (recent breakout retest zone)
Price frequently moves toward these zones to capture stop-loss liquidity and rebalance leveraged positions.
6. Whale Order Activity
Large order activity appears near $0.0165–$0.0170, suggesting significant sell-side liquidity in this region. Meanwhile, visible demand near $0.0145–$0.0150 indicates buyers defending the breakout level, which may represent whale accumulation rather than distribution.
7. Futures and Derivatives Data
Given the rapid 50% intraday move, derivatives metrics likely show:
Rising open interest indicating new leveraged positions.
Positive funding rates, suggesting long dominance.
This setup can produce two outcomes:
Short squeeze continuation if resistance breaks.
Long liquidation cascade if price drops below the breakout level.
Currently the market appears slightly overheated but still structurally bullish.
8. Confluence Zones
Important technical confluence areas include:
Bullish confluence
$0.0168 – $0.0175
Resistance + potential short liquidation zone
Bearish confluence
$0.0145 – $0.0140
Breakout retest + liquidity cluster
9. Trade Scenario Planning
Bullish Scenario
Breakout above $0.0168
Targets:
$0.0178
$0.0190
$0.0200
Bearish Scenario
Breakdown below $0.0145
Targets:
$0.0132
$0.0120
$0.0105
10. Conclusion
PIXEL has transitioned from a long downtrend into a high-momentum recovery phase. The key technical battleground is the $0.0168 resistance zone and the $0.0145 breakout support. Sustained strength above resistance could trigger another short-squeeze driven rally, while failure to hold support may lead to profit-taking and a deeper retracement toward $0.012. Traders should closely monitor volume behavior and liquidity reactions near these levels to confirm the next directional move.I


#BTCReclaims70k #PCEMarketWatch #AaveSwapIncident