1. Market Overview
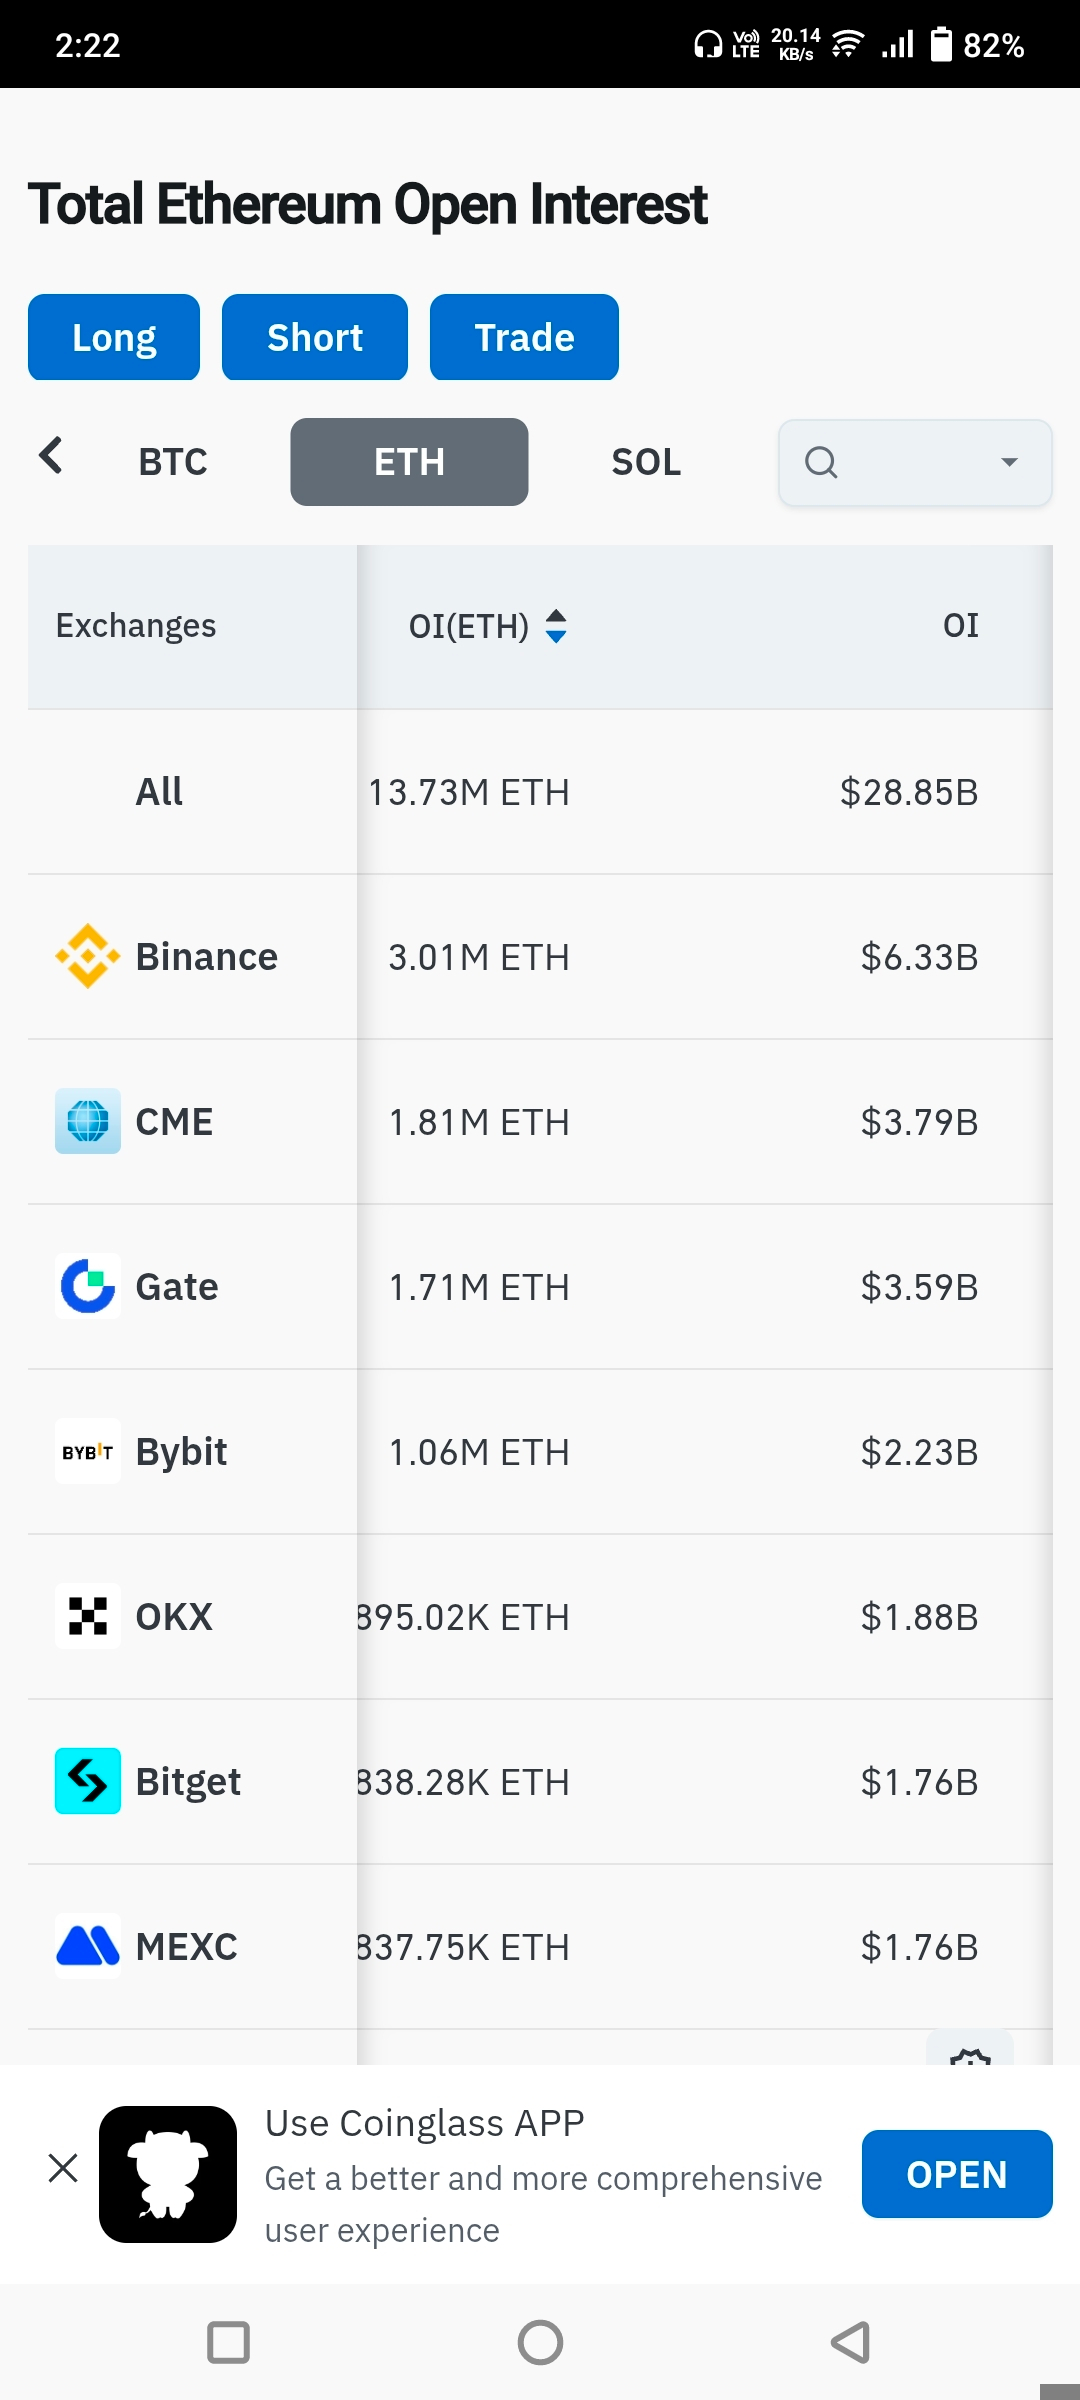
Ethereum is currently trading near $2,100, showing a short-term recovery after a prolonged corrective phase that began in late 2025. Price has rebounded from the February lows and is now testing important intermediate resistance levels. Market participation remains elevated, with total futures open interest around 13.7M ETH (~$28.8B), indicating significant leveraged positioning. This environment typically leads to liquidity-driven price movements, where stop clusters and derivatives positioning strongly influence direction.
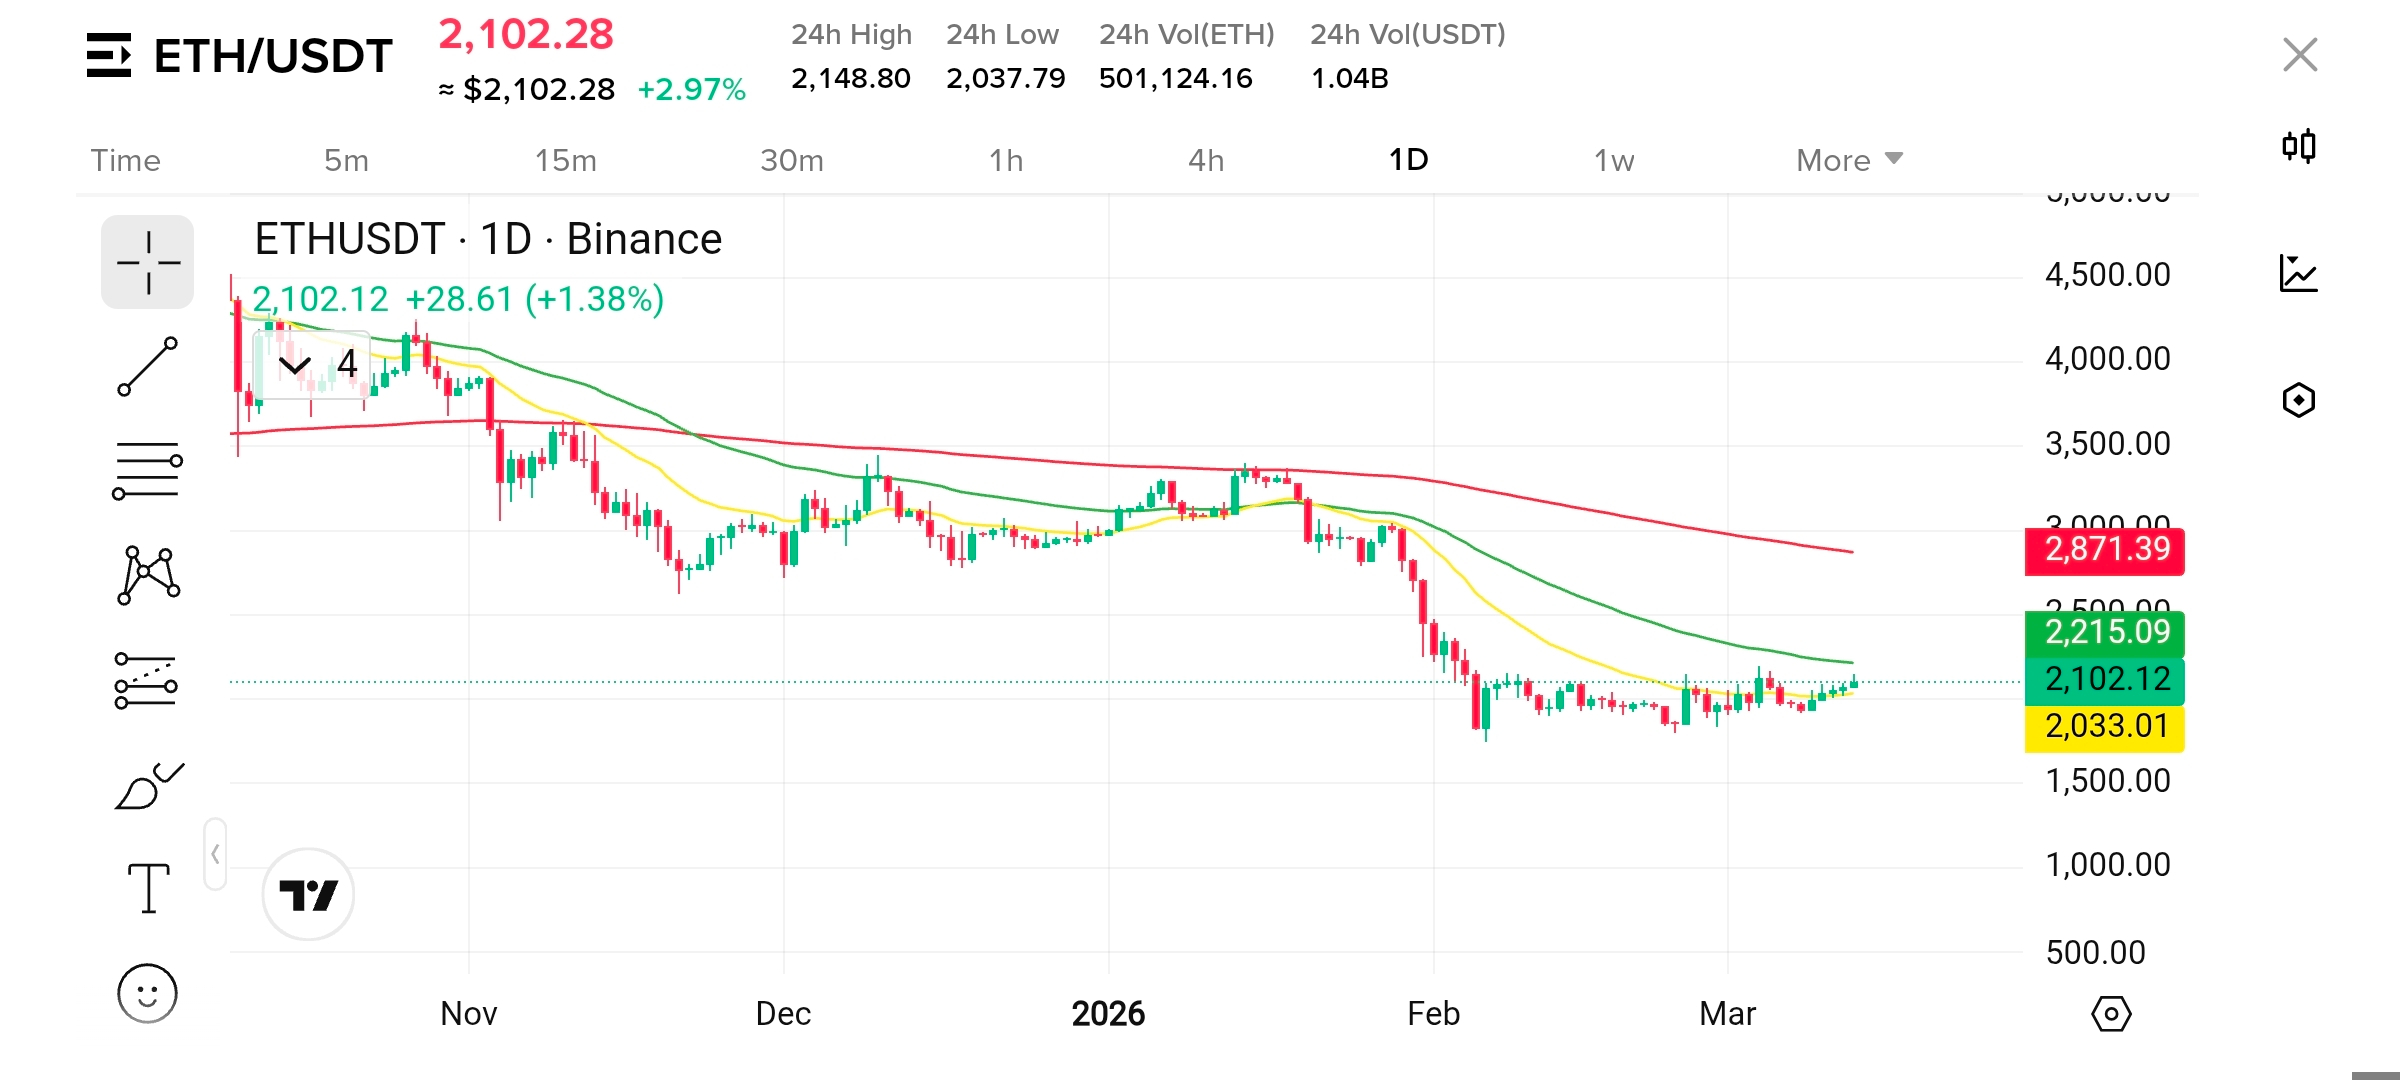
2. 1D Timeframe Analysis
On the daily timeframe, Ethereum remains in a macro downtrend, although recent price action suggests early stabilization.
Trend structure
The market is transitioning from lower lows to a potential higher-low formation.
Price is attempting to reclaim the mid-range of the broader consolidation band.
Key levels
Major resistance: $2,215 – $2,870 (macro moving average and supply zone)
Primary support: $2,030 – $1,900
A sustained move above $2,200 would be required to confirm a structural shift toward a bullish trend.
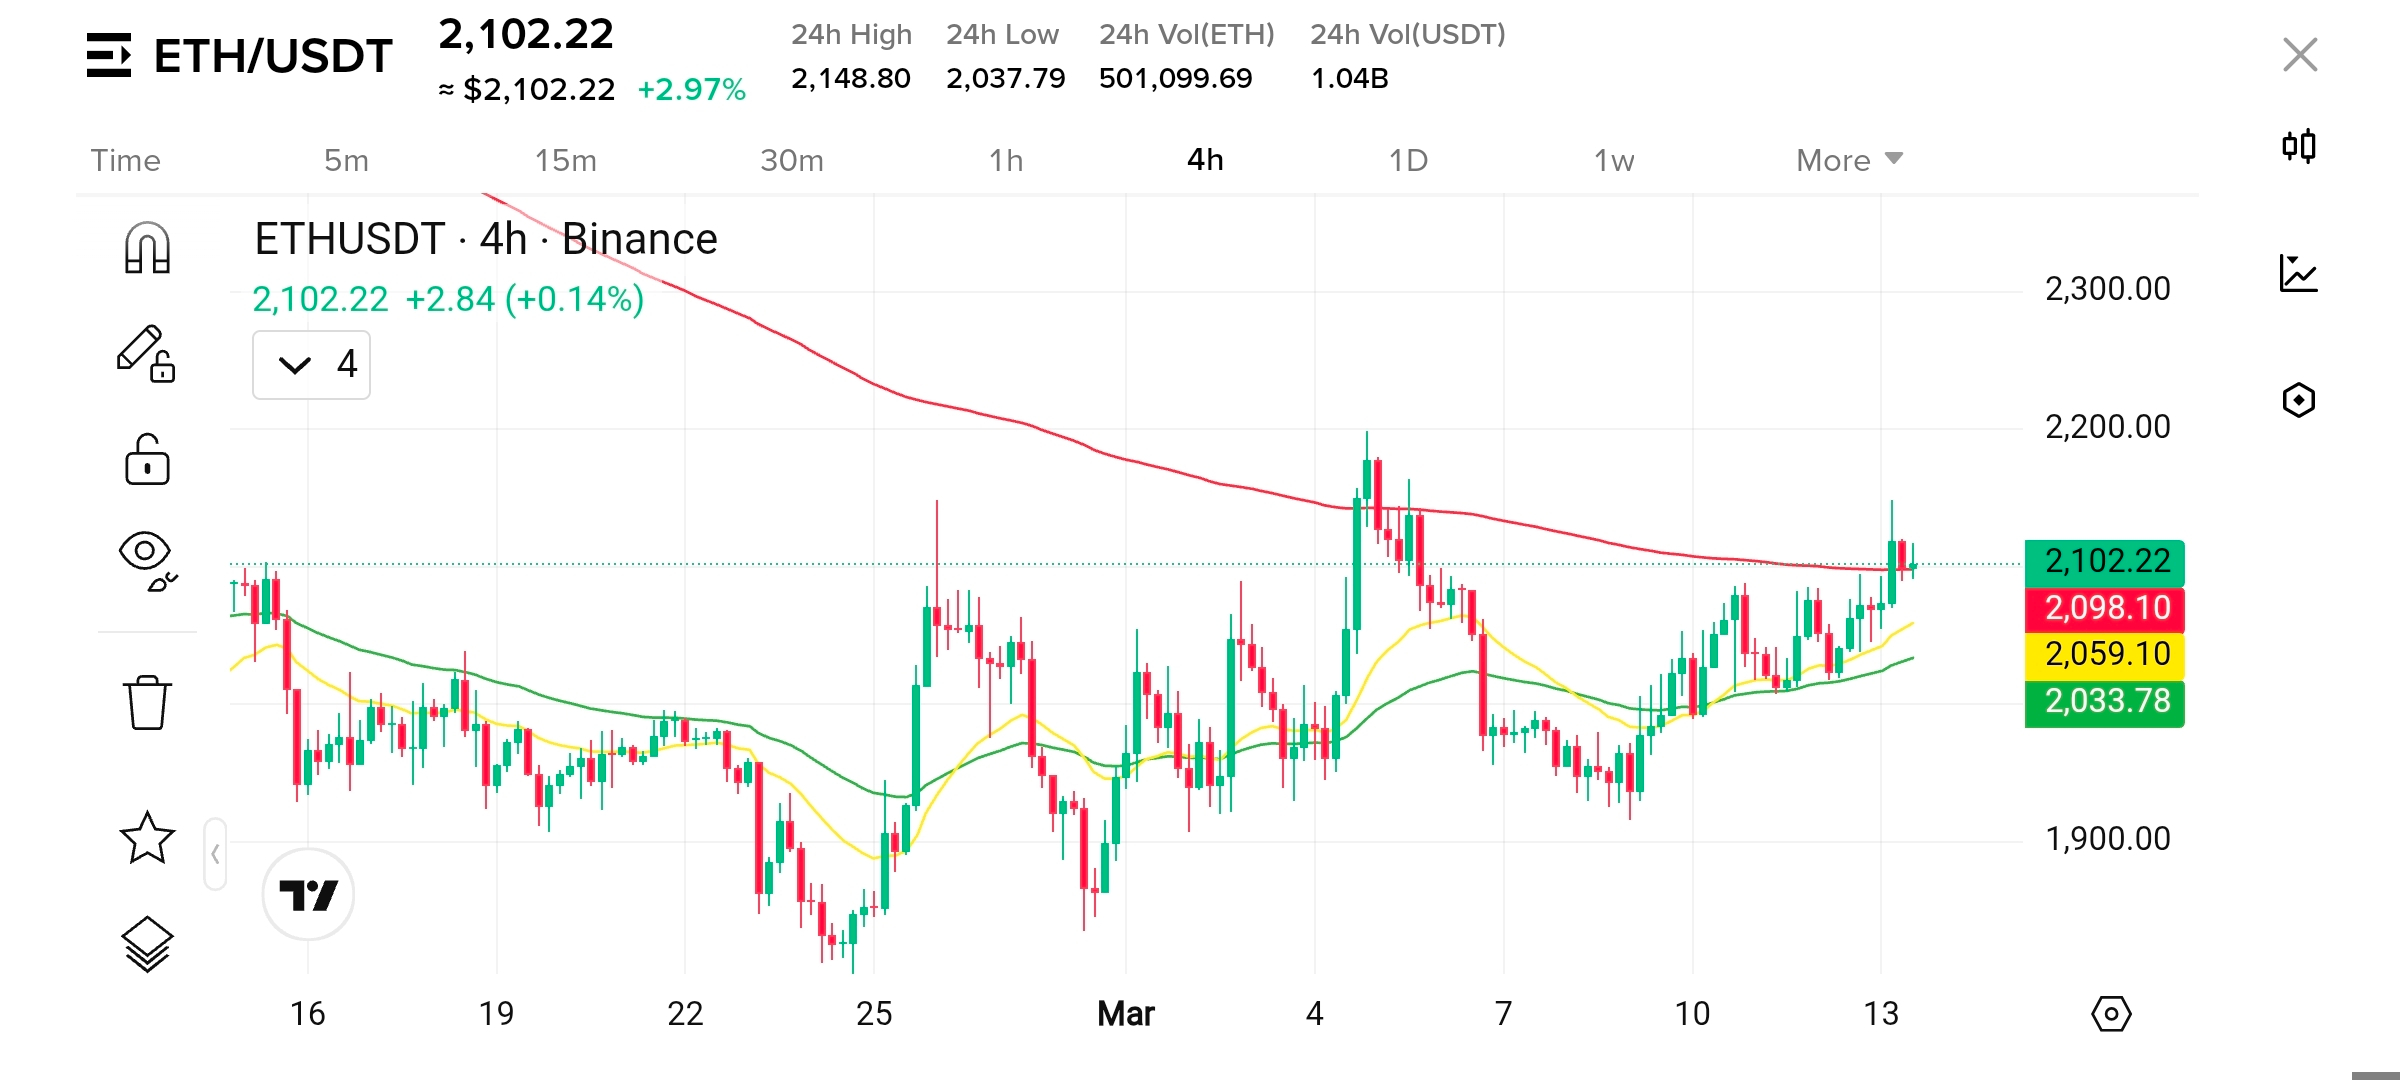
3. 4H Timeframe Analysis
The 4-hour chart shows improving intermediate momentum.
Observations:
Price has reclaimed the short-term moving averages, indicating increasing buying pressure.
A series of higher lows has formed since the early-March bottom.
Ethereum is approaching a key resistance zone near $2,150–$2,200.
A decisive breakout above this region could trigger momentum expansion toward higher liquidity zones.
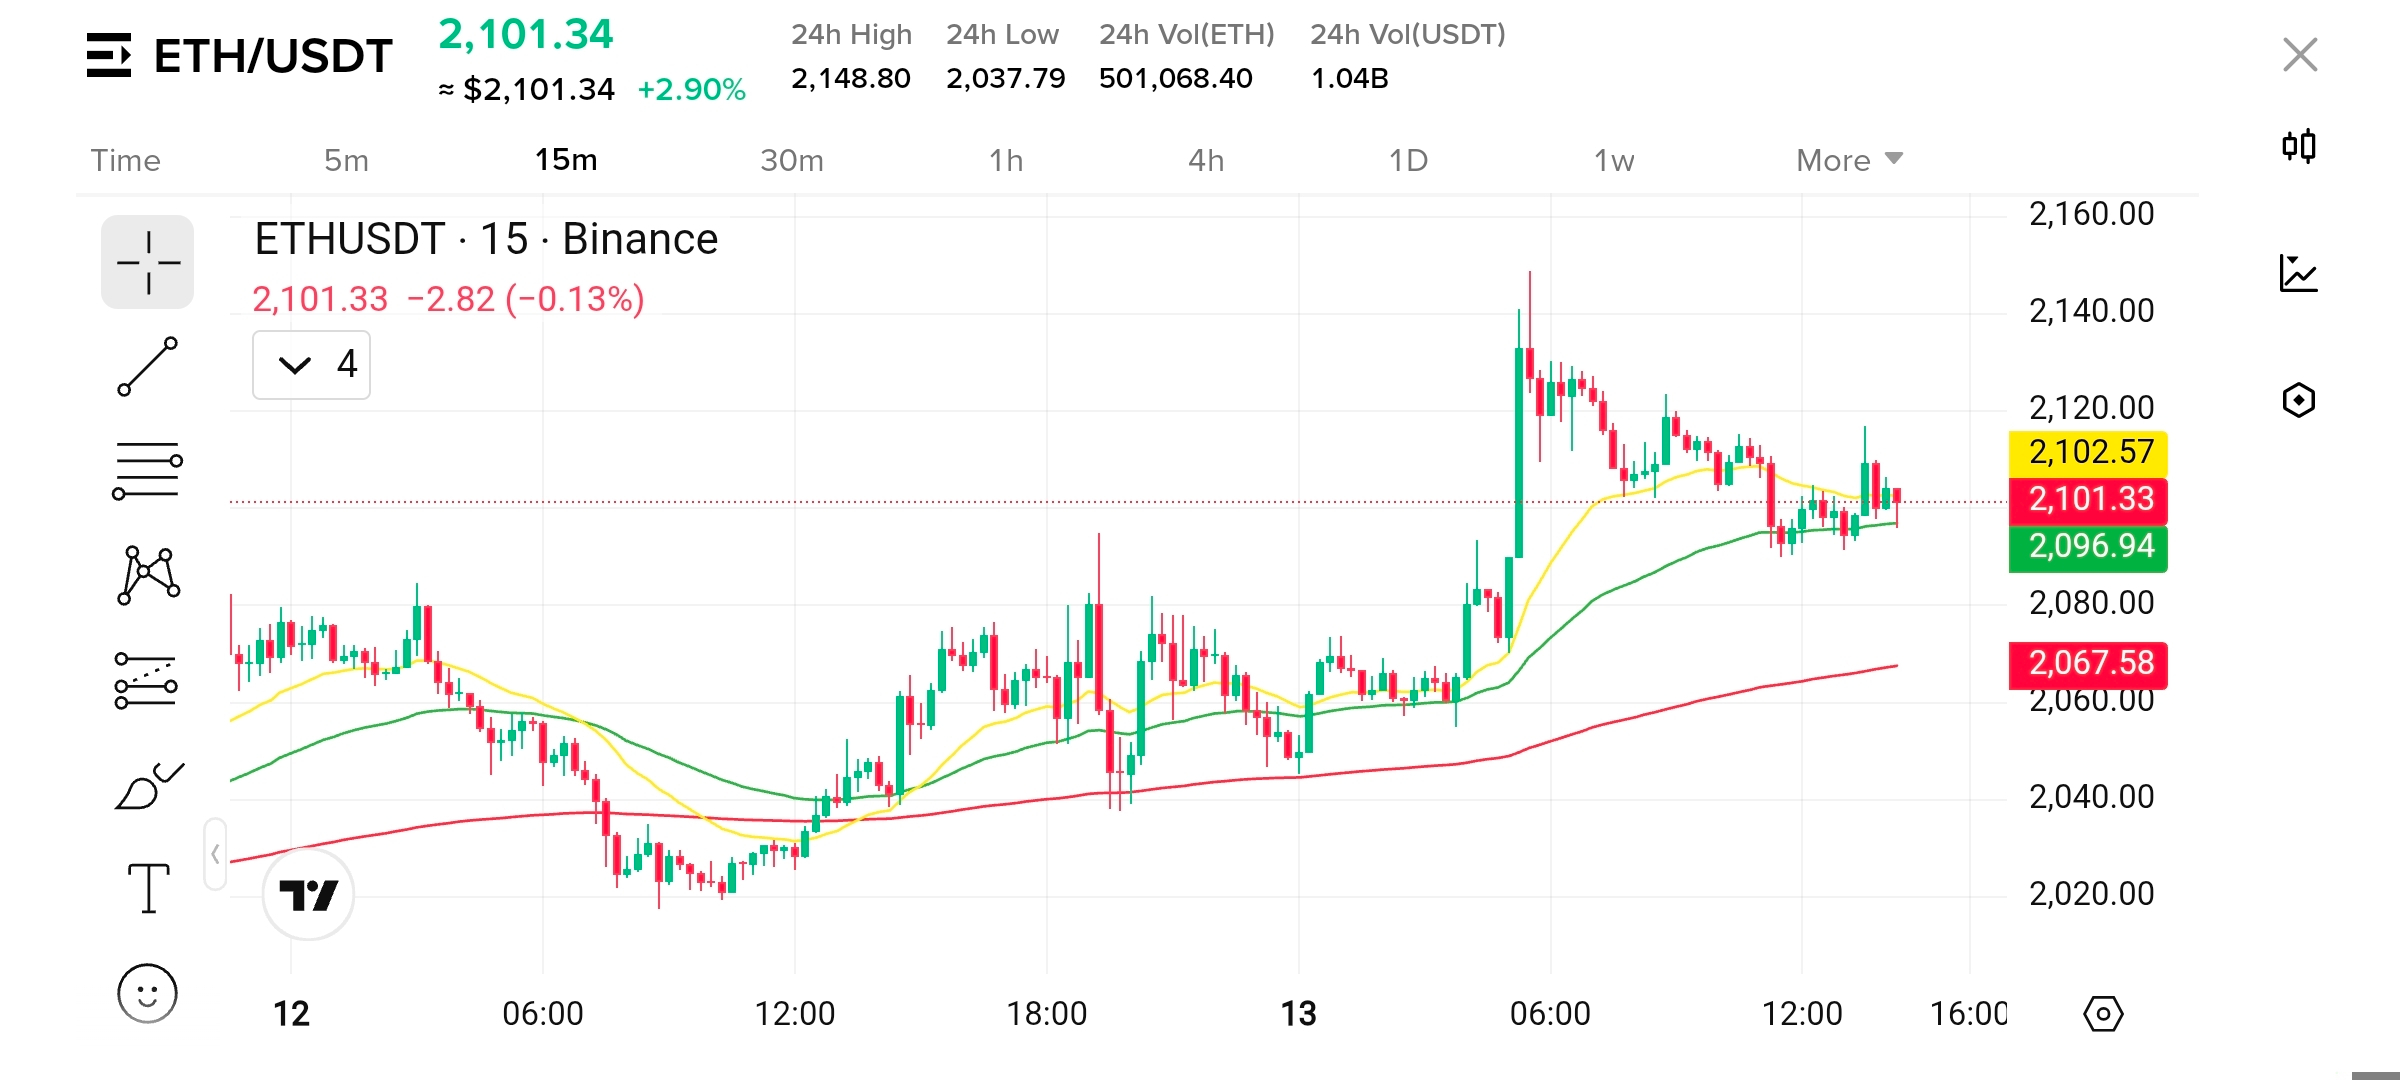
4. 15M Timeframe Analysis
The 15-minute timeframe reflects consolidation after a sharp upward impulse.
Structure:
Short-term range formation between $2,095 and $2,120.
Price remains above intraday support levels, maintaining mild bullish intraday bias.
Intraday levels:
Immediate support: $2,095 – $2,070
Resistance: $2,120 – $2,150
Scalping activity is likely concentrated within this narrow range until a breakout occurs.
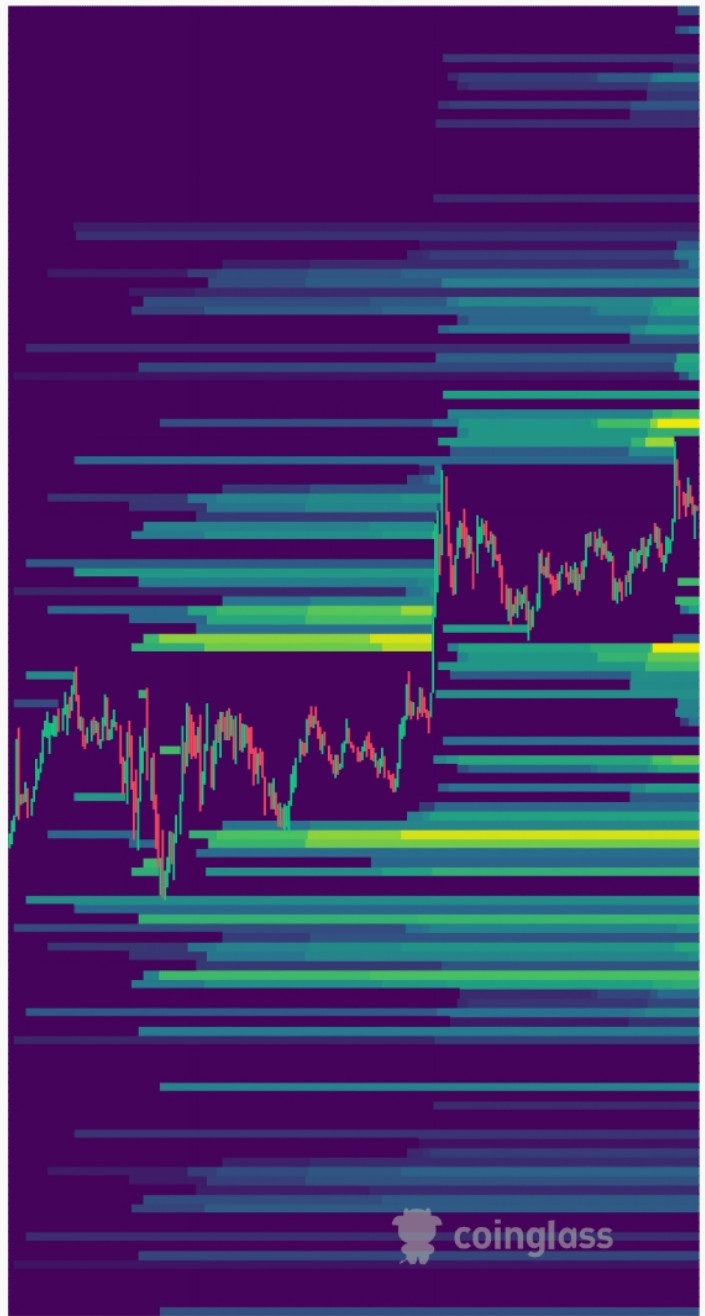
5. Liquidity Heatmap Analysis
The liquidity heatmap highlights dense liquidity bands above and below current price.
Key clusters:
Above price: $2,150 – $2,220
Below price: $2,050 – $2,000
These areas likely contain large stop-loss concentrations and liquidation pools, making them probable short-term price targets as the market seeks liquidity.
6. Whale Order Activity
Large resting sell orders appear near $2,150–$2,200, suggesting strong overhead supply. Meanwhile, buy-side liquidity around $2,050–$2,070 indicates whales may be accumulating within the current range rather than aggressively distributing.
7. Futures and Derivatives Data
With 13.7M ETH in open interest, derivatives participation is elevated.
Interpretation:
High OI suggests crowded positioning.
If resistance breaks, short liquidations could accelerate upside momentum.
A move below $2,050 could trigger long liquidation cascades.
Overall conditions appear balanced but vulnerable to volatility spikes.
8. Confluence Zones
Key technical and liquidity confluence areas include:
Bullish confluence
$2,150 – $2,200
Resistance zone + overhead liquidity cluster
Bearish confluence
$2,050 – $2,000
Structural support + liquidation pool
9. Trade Scenario Planning
Bullish Scenario
Breakout above $2,150
Potential targets:
$2,220
$2,300
$2,450 (liquidity expansion zone)
Bearish Scenario
Breakdown below $2,050
Downside targets:
$2,000
$1,920
$1,850
10. Conclusion
Ethereum is currently attempting to transition from a macro corrective phase into short-term recovery, with price testing the critical $2,150 resistance zone. Elevated derivatives positioning suggests that the next directional move may be driven by liquidity sweeps and leveraged liquidations. Traders should closely monitor $2,150 for bullish continuation and $2,050 as key support, as a break of either level could trigger rapid volatility expansion.
#BTCReclaims70k #PCEMarketWatch #AaveSwapIncident