1. Market Overview
Bitcoin is currently trading around $71,800, showing short-term strength after recovering from the February decline. The market structure suggests a gradual recovery phase, with price reclaiming key moving averages on lower timeframes while still facing macro resistance on the daily chart. Derivatives positioning remains elevated, with total open interest near 688K BTC, indicating strong participation from leveraged traders. This environment typically increases the probability of volatility expansions and liquidity sweeps.
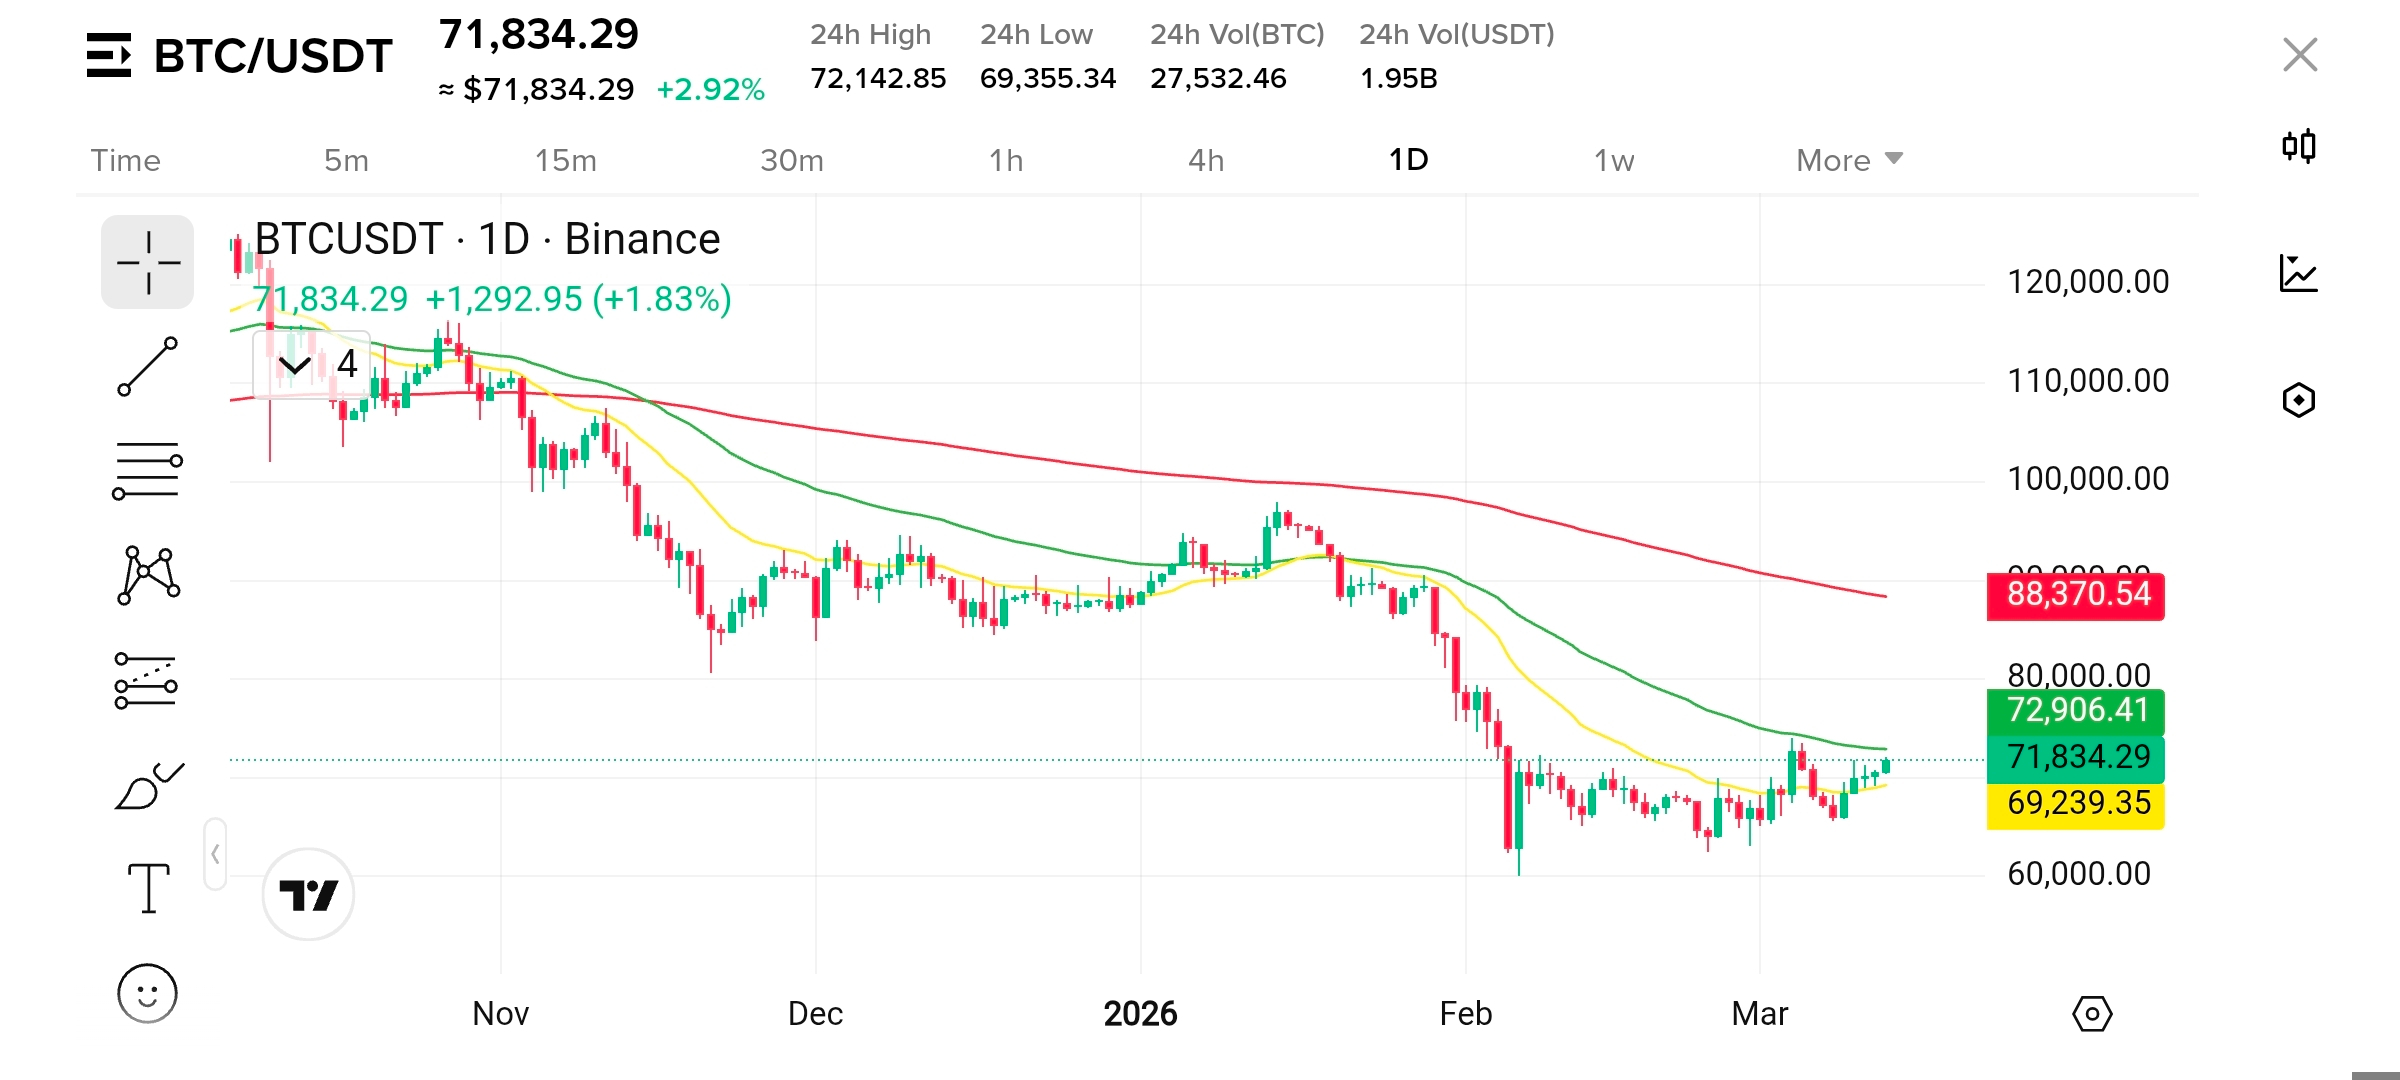
2. 1D Timeframe Analysis
On the daily timeframe, Bitcoin remains in a macro corrective structure following the sharp drawdown from the previous highs.
Trend structure
The market is transitioning from lower lows to potential higher lows, suggesting early signs of stabilization.
Price is currently testing the mid-range of the broader consolidation zone.
Key levels
Resistance: $72,900 – $88,300 (major moving average and macro supply)
Support: $69,200 – $65,000
The daily trend will only shift bullish if Bitcoin reclaims the $73K–$75K region with strong volume, confirming a structural reversal.
---
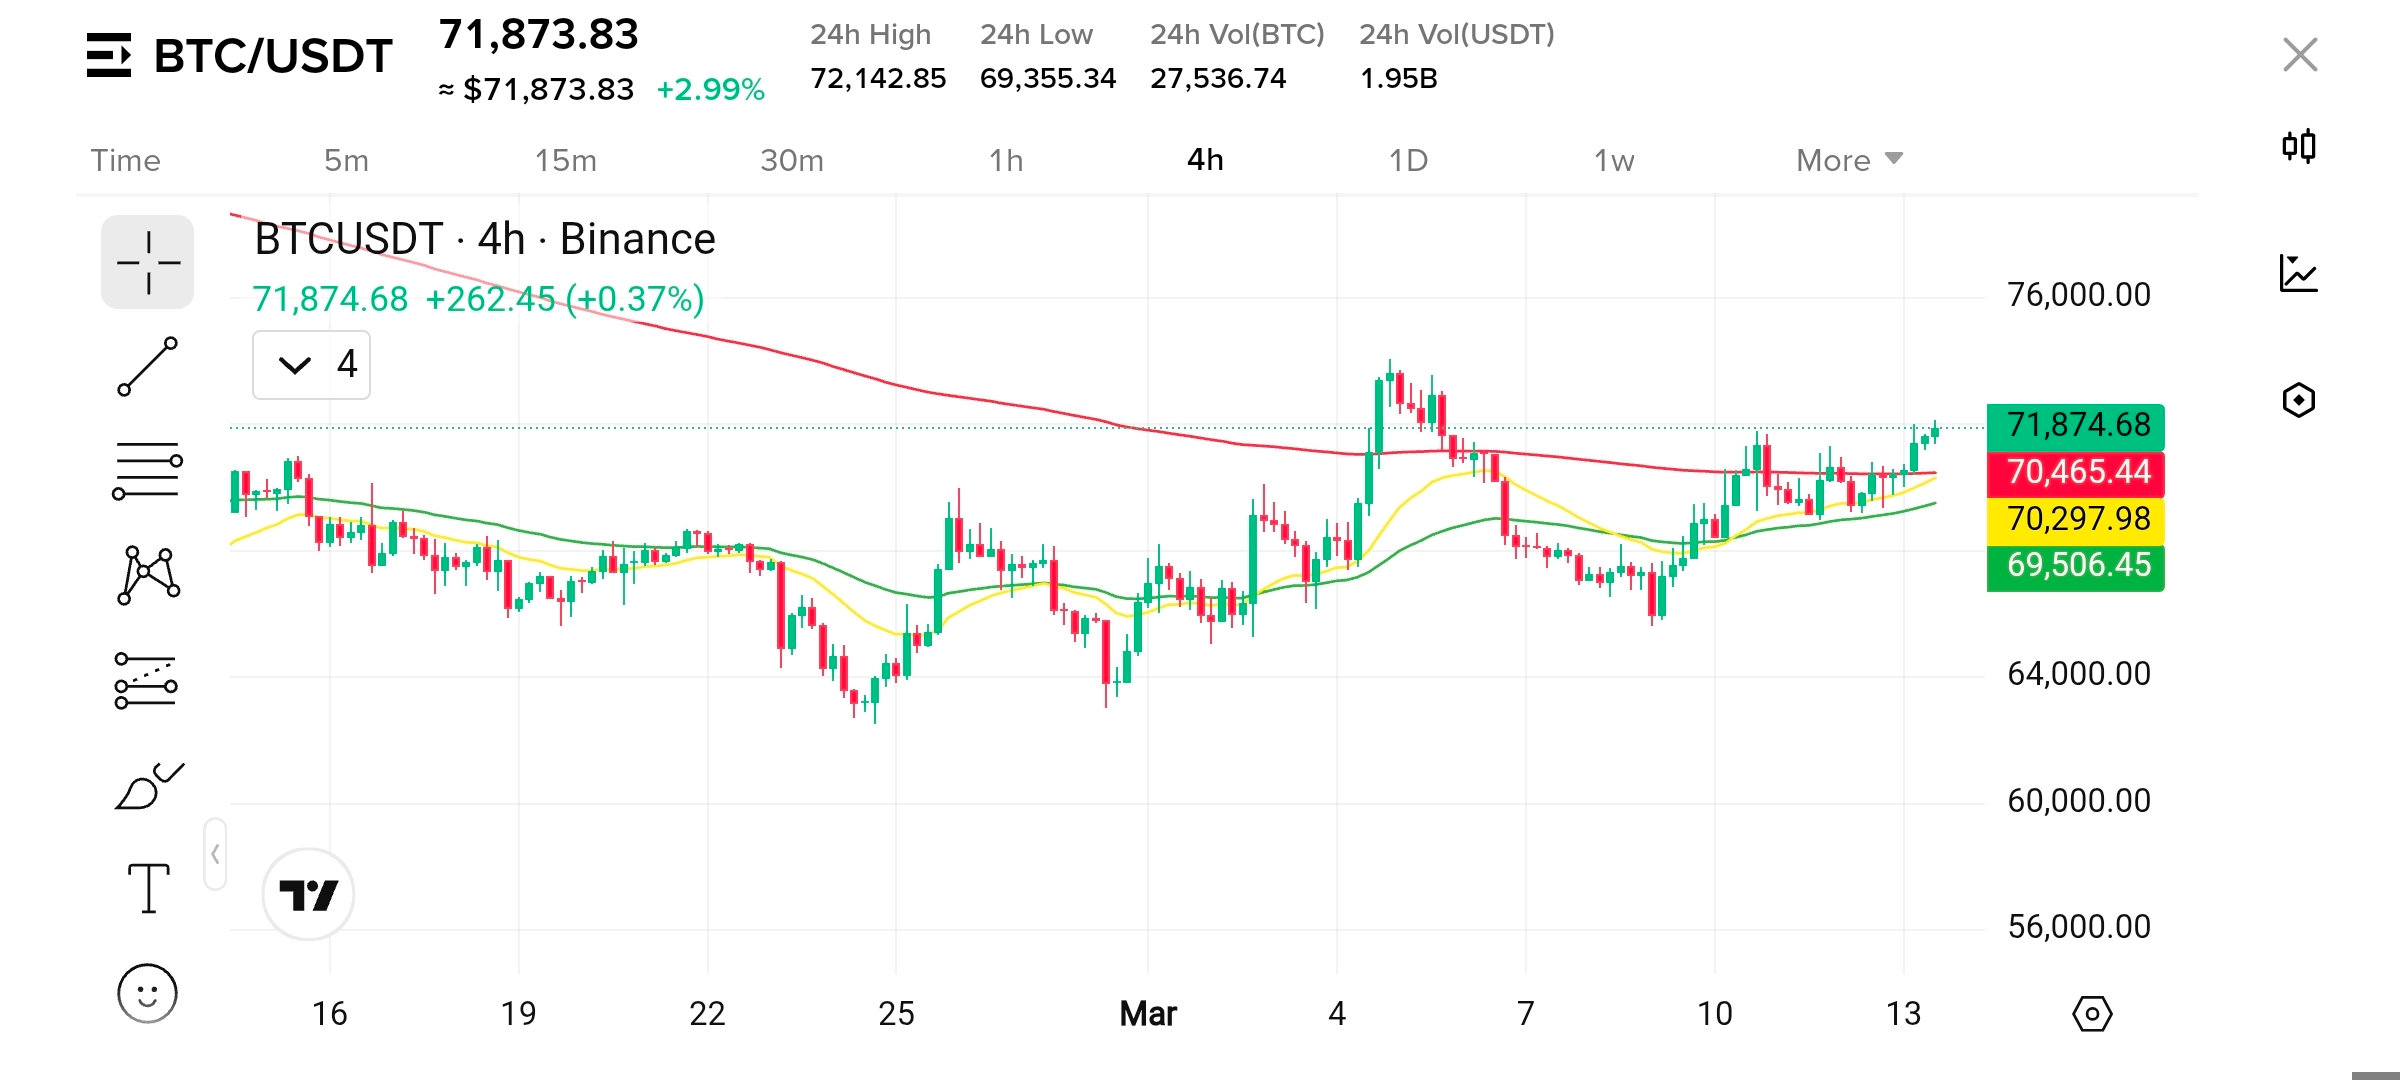
3. 4H Timeframe Analysis
The 4-hour chart shows improving momentum.
Observations:
Price has reclaimed the 4H moving averages, signaling short-term bullish pressure.
A series of higher lows has formed since the early-March bottom.
Bitcoin is approaching a local resistance band near $72K–$72.5K.
A clean break above this region could trigger momentum continuation toward the upper liquidity zones.
---
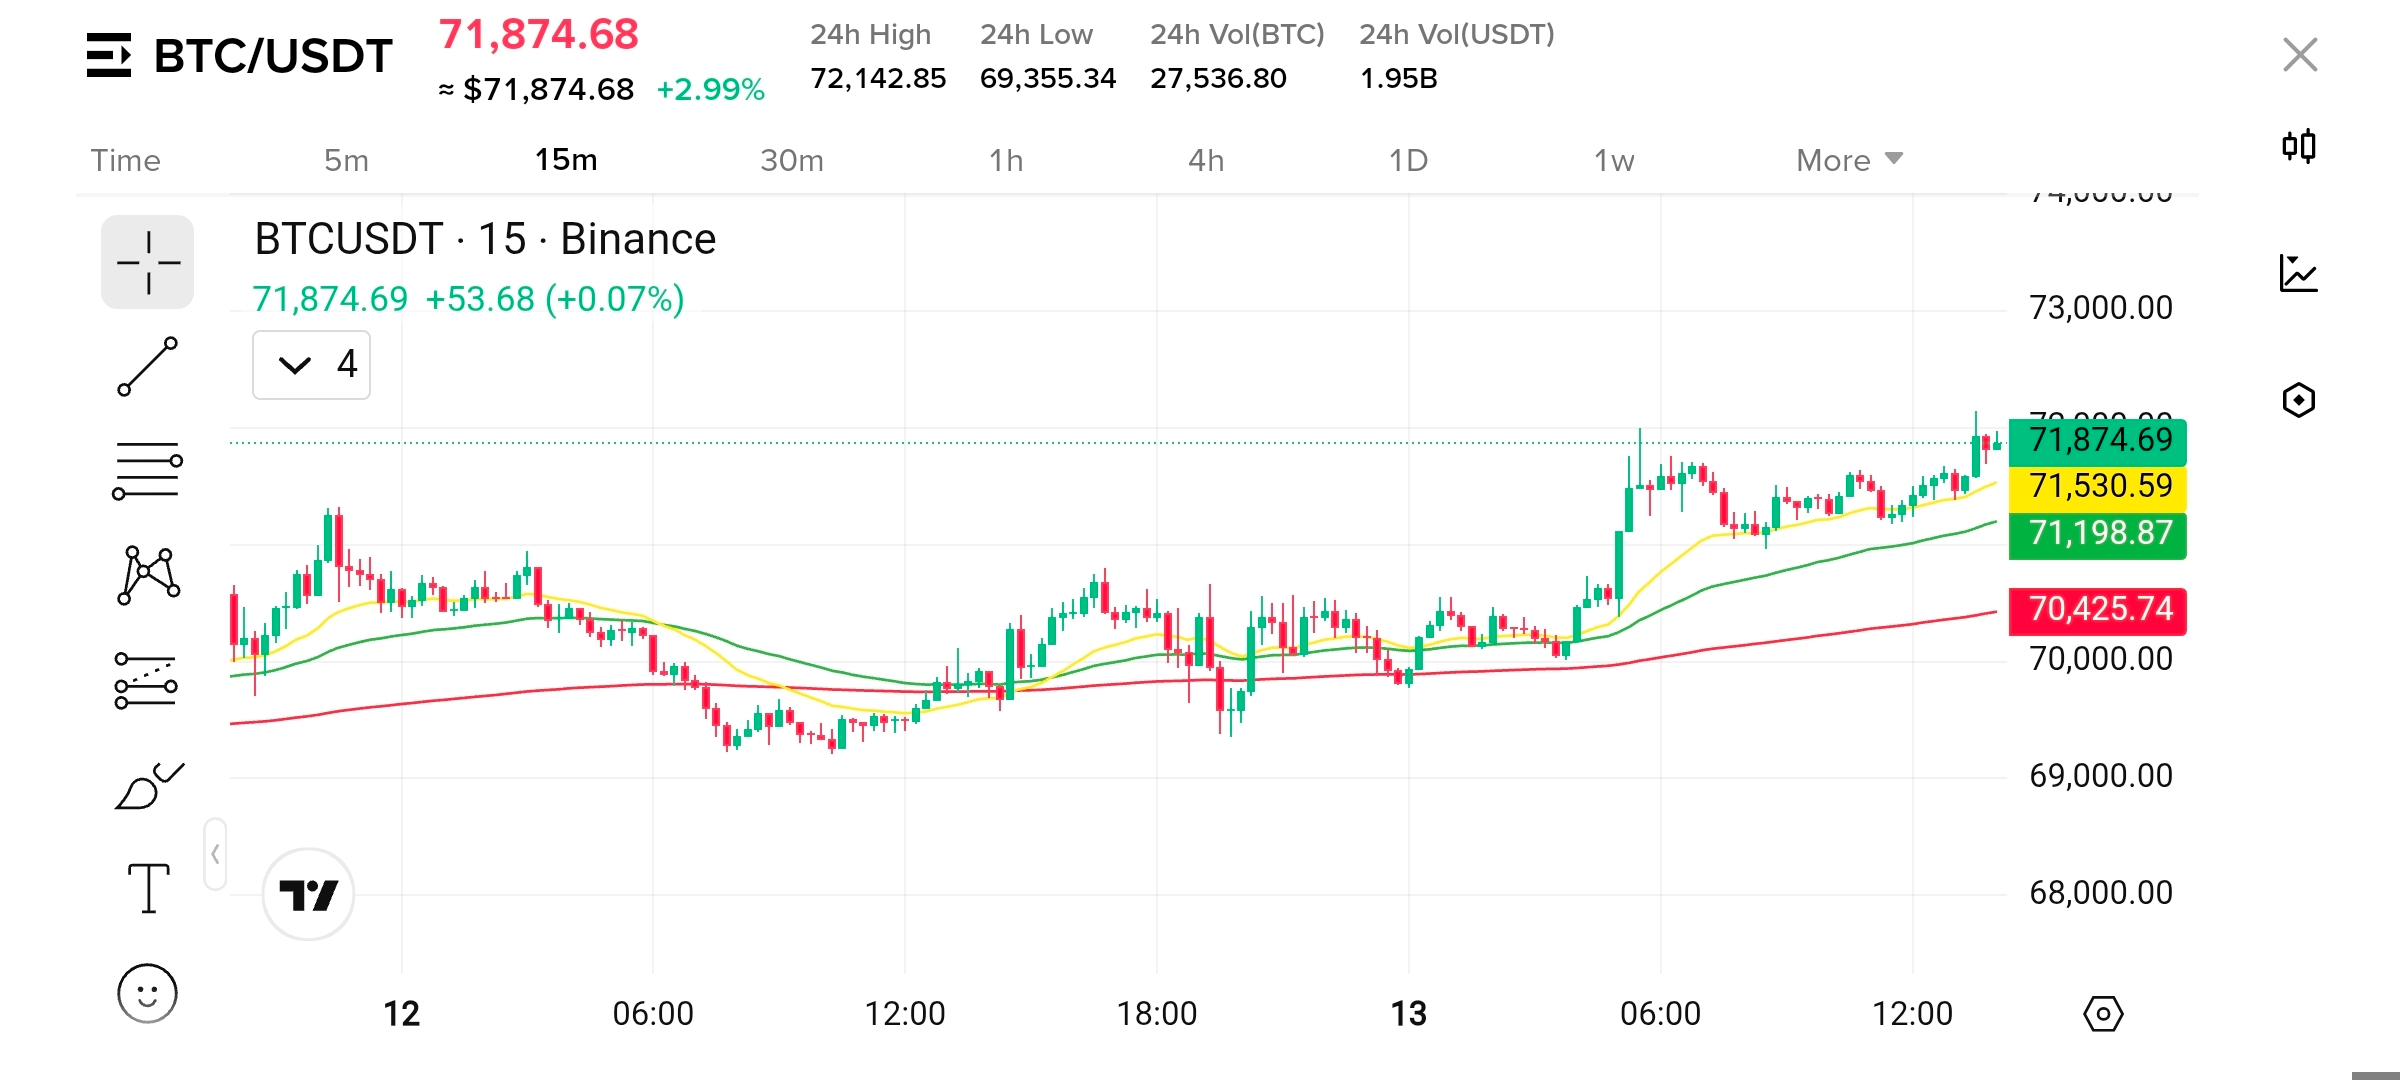
4. 15M Timeframe Analysis
The 15-minute chart reflects strong intraday momentum.
Structure:
Short-term ascending structure with higher highs and higher lows.
Price is trading above key intraday moving averages.
Intraday levels:
Immediate support: $71,500 – $71,200
Resistance: $72,100 – $72,400
Scalping activity is currently concentrated within this $71K–$72K micro range.
---
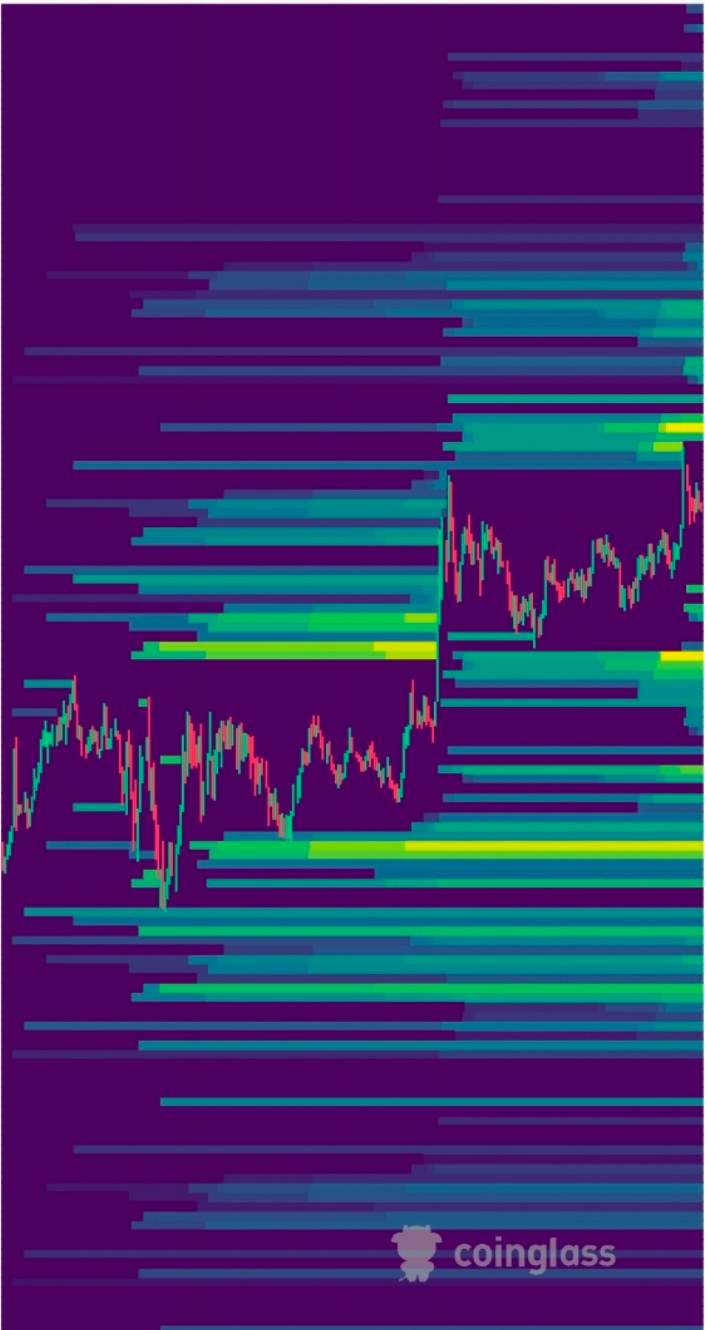
5. Liquidity Heatmap Analysis
The liquidity heatmap reveals dense clusters both above and below the current price.
Major liquidity zones:
Above: $72,500 – $73,200
Below: $70,800 – $69,800
These areas likely contain large stop-loss pools and liquidation levels, making them probable short-term price targets.
---
6. Whale Order Activity
Large resting orders appear around $72K–$73K, suggesting significant sell-side liquidity in that zone. Meanwhile, strong bid clusters are visible near $70K–$71K, indicating whales may be defending accumulation levels.
Overall behavior suggests range-based accumulation rather than aggressive distribution.
---
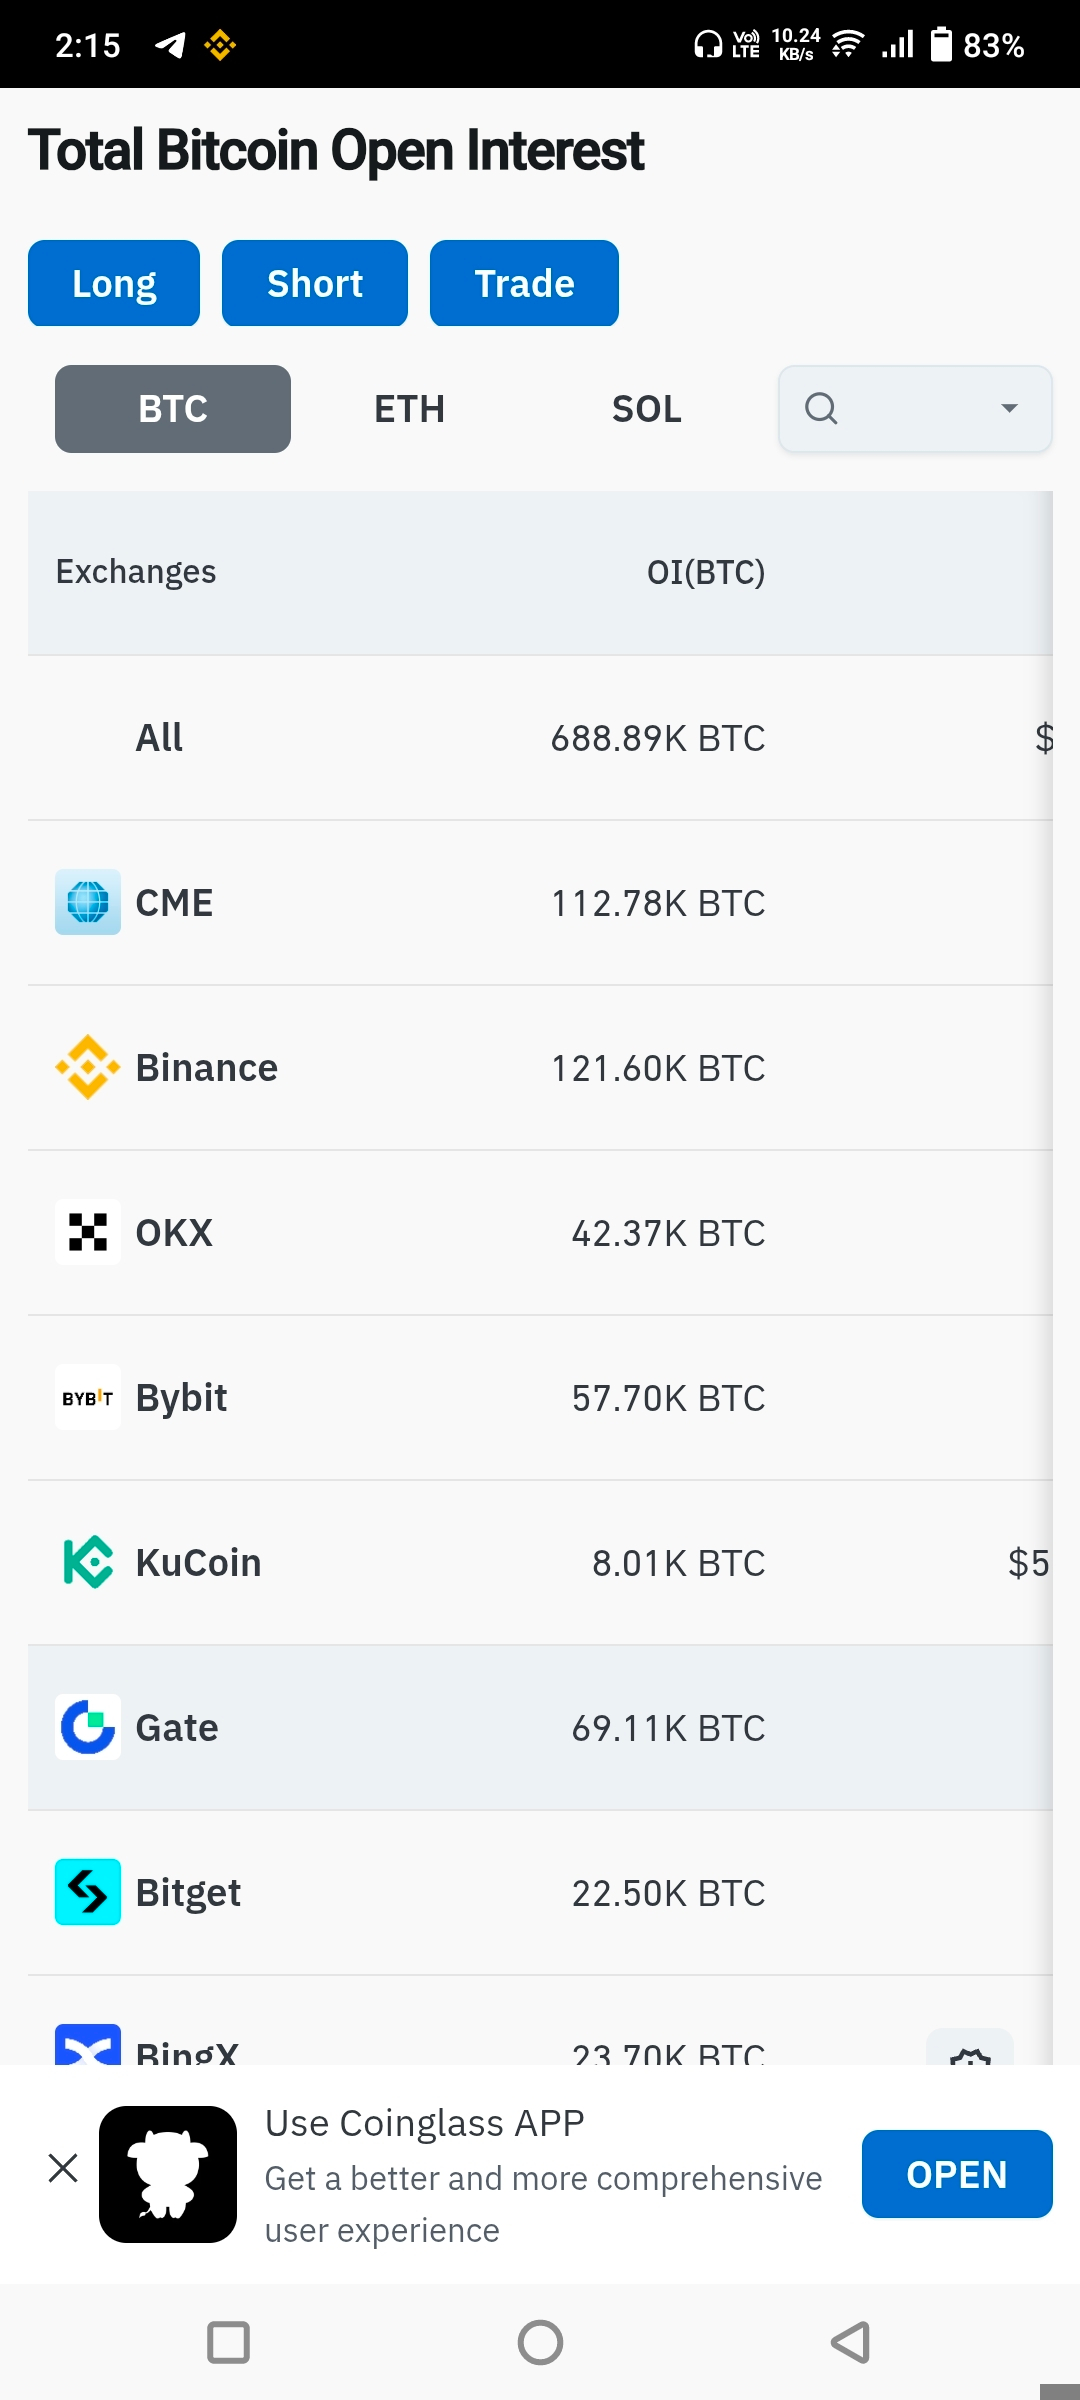
7. Futures and Derivatives Data
Total open interest across exchanges is approximately 688K BTC, with major concentration on Binance and CME.
Interpretation:
Elevated OI implies high leveraged exposure.
If price breaks resistance, short liquidations could accelerate upside momentum.
Conversely, a drop below $70K could trigger long liquidation cascades.
Current conditions suggest a balanced but fragile derivatives environment.
8. Confluence Zones
Strong confluence appears in two regions:
Bullish confluence
$72,500 – $73,000
Liquidity cluster + resistance breakout level
Bearish confluence
$70,800 – $70,000
Support + liquidation liquidity pool
9. Trade Scenario Planning
Bullish Scenario
Breakout above $72,500
Potential targets:
$73,200
$74,800
$76,000 (liquidity expansion zone)
Bearish Scenario
Breakdown below $70,800
Downside targets:
$69,800
$68,500
$65,000
10. Conclusion
Bitcoin is showing short-term bullish momentum within a broader recovery phase, but the market remains highly dependent on liquidity flows and derivatives positioning. The $72.5K resistance zone is the critical level to monitor for breakout confirmation, while $70K serves as key structural support. Traders should watch for liquidity sweeps and leverage flushes, as elevated open interest suggests the next directional move could be sharp and volatility-driven.
#BTCReclaims70k #PCEMarketWatch #AaveSwapIncident