Bitcoin is trading around $67,925 as of 8 a.m. EST, valuing the network near $1.35 trillion in market cap. Over the past 24 hours, roughly $51.15 billion has changed hands, with price moving between $65,932 and $68,371.
Right now, BTC is moving sideways just below a major resistance zone. The recent bounce is running into a bigger bearish trend on higher timeframes. While momentum is trying to level out, the overall technical picture shows the market still needs stronger confirmation before any real shift higher.
Bitcoin Chart Outlook
On the daily timeframe, bitcoin is still in a bearish structure, shown by consistent lower highs and lower lows after the strong rejection around $97,900. The sharp selloff that wicked down near $59,930 looked like a panic flush, which was followed by a bounce back into the $68,000–$70,000 zone where price is now tightening.
Key resistance sits around $70,000 to $72,000, with a wider selling area between $75,000 and $80,000. Solid support is near $60,000, and if price slips under $59,000, the next downside area opens around $52,000 to $54,000.
Unless BTC can break back above $72,000 with strong volume, the daily outlook stays bearish.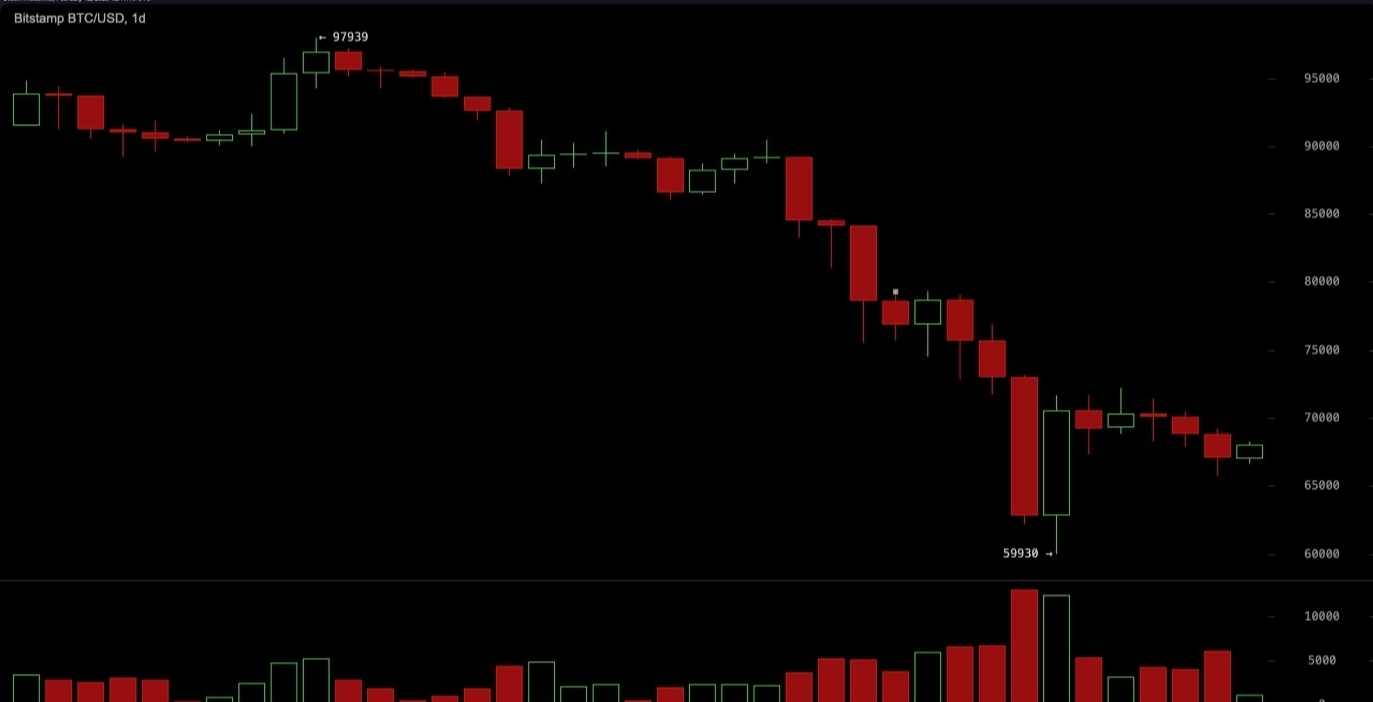
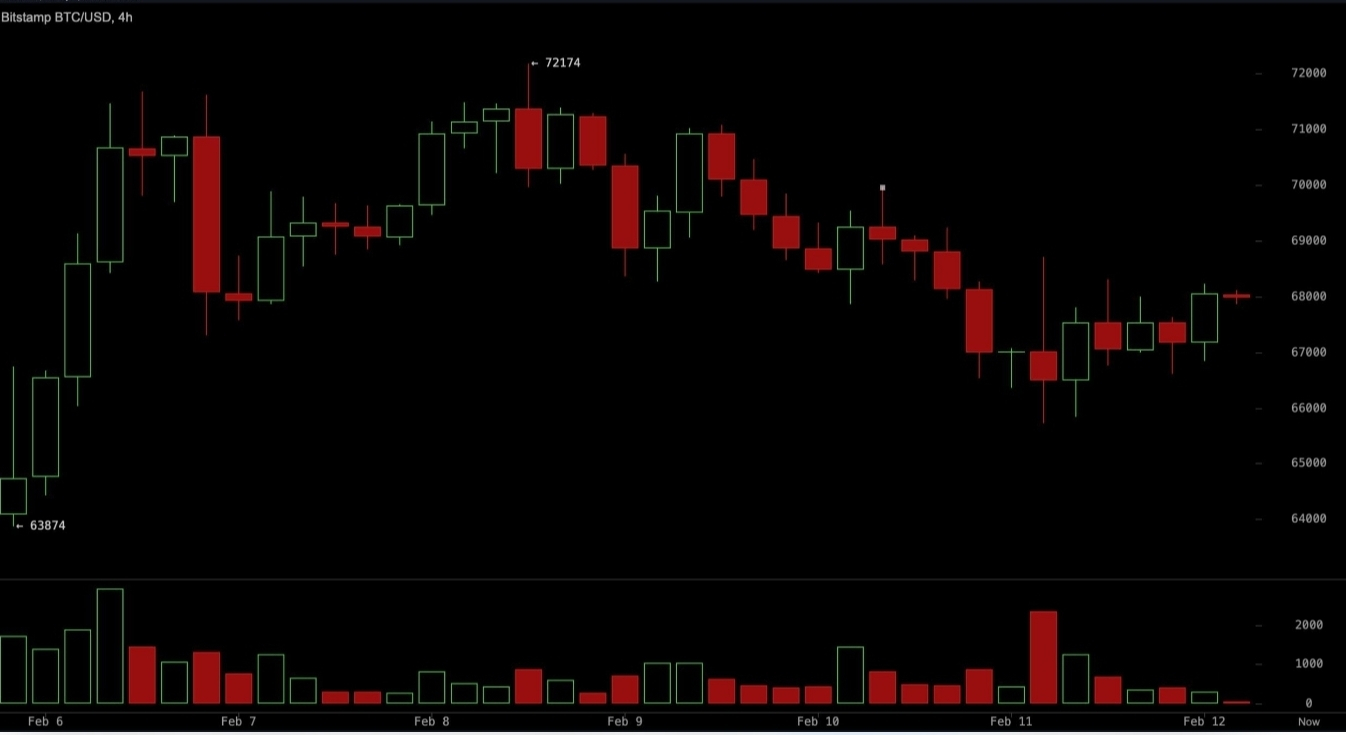
On the 4 hour chart, bitcoin is showing a bounce that fits more as a pullback inside the larger downtrend. After dipping near $66,000, price has slowly pushed up toward the $68,000–$69,000 area, but trading volume is fading as it moves higher which points to weak buying strength.
Resistance is stacked around $69,500 to $71,000, while short term support is holding near $66,000 with a critical breakdown zone around $64,000. From a structure point of view, this looks like a classic relief move instead of a real trend reversal the type of bounce that feels bullish at first but usually runs into selling pressure above.
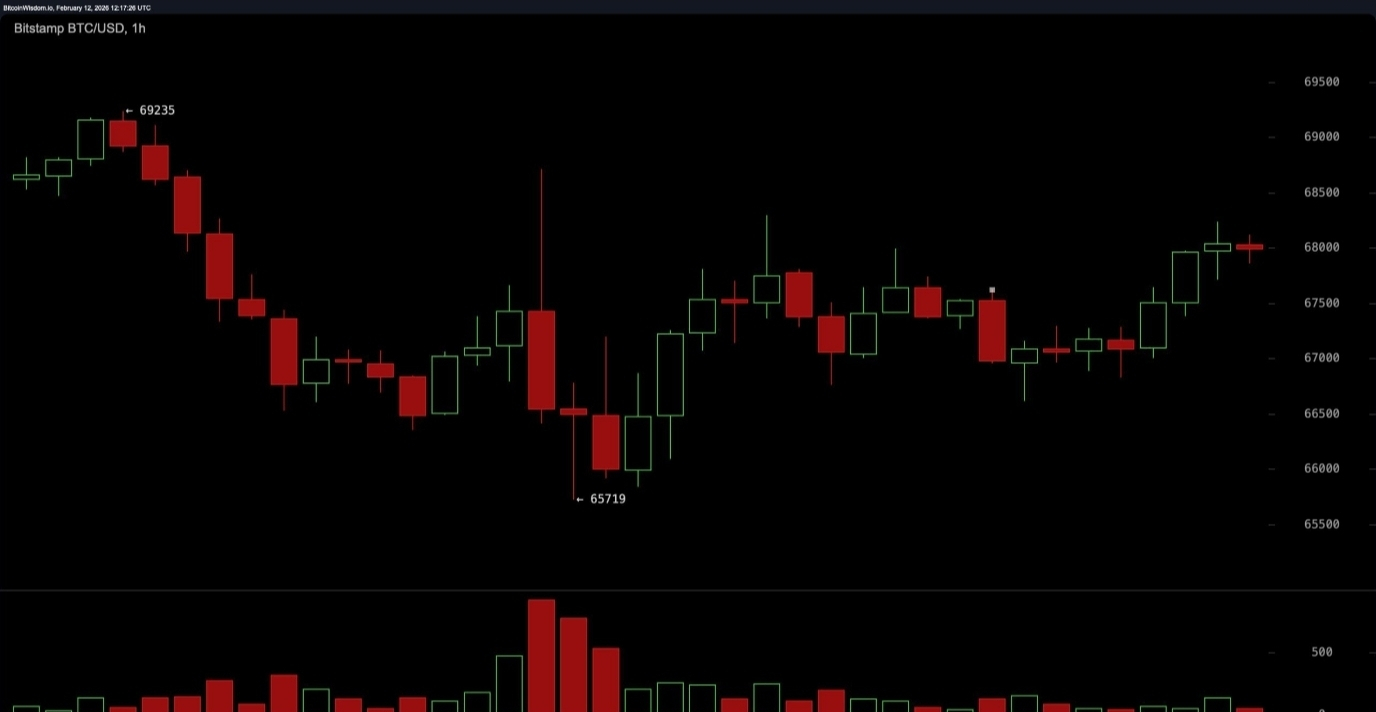
On the 1 hour timeframe, price is looking slightly stronger in the short term, forming small higher highs and higher lows that point to brief bullish momentum. Resistance is sitting around $68,500 to $69,000, and volume isn’t showing a strong surge yet, so any breakout still needs solid confirmation.
If bitcoin can hold above $69,000, it could push toward the $70,000 to $71,000 area. But if price drops back below $67,000, that short term bullish setup breaks down. Rejection around $69,000 to $70,000 could also send price back toward $66,000, and possibly as low as $64,000.
There’s some near term strength showing, but it’s still happening within a bigger bearish trend.
Momentum indicators suggest the market is cooling off and trying to steady, but not actually turning bullish yet. The RSI sits around 32, close to oversold but still neutral. The Stochastic is near 29, also in neutral territory. The CCI is about –85, which remains neutral as well.
The ADX is high around 54, showing a strong trend is still in play overall. The Awesome Oscillator is negative near –14,576, staying neutral, while momentum is at roughly –10,705, flashing a sell signal. The MACD is around –5,734, also giving a sell signal.
Overall, nothing here points to excitement or a strong reversal yet the tone remains cautious and heavy.
Moving averages are signaling a clear bearish trend across all key timeframes. Both simple moving averages (SMA) and exponential moving averages (EMA) are pointing down, showing ongoing selling pressure.
The shorter-term EMA (10) at $70,809 and SMA (10) at $69,539 are both in sell territory. The EMA (20) at $75,466 and SMA (20) at $77,022 confirm continued weakness. Longer-term averages follow the same pattern, with EMA (30) at $78,695, SMA (30) at $82,215, EMA (50) at $82,727, and SMA (50) at $85,372, all reinforcing the downward bias.
The moving average picture clearly favors the bears.
Even the longer-term averages are bearish, with the EMA (100) at $89,003 and SMA (100) at $88,709, as well as the EMA (200) at $94,887 and SMA (200) at $101,303, all showing sell signals. Overall, the trend continues to favor the downside, and breaking back above $72,000 with strong volume remains the key level for any meaningful upside shift.
Bull Verdict
If bitcoin manages to break and stay above $69,000 with rising volume, short-term momentum on the 1-hour chart could push price toward the $70,000–$72,000 resistance zone. Clearing $72,000 convincingly would start to weaken the daily bearish pattern and test the existing lower-high structure. In that case, what looks like a simple relief bounce could turn into a more significant move, shifting the market from a reactive rebound to a possible trend change.
Bear Verdict
If bitcoin cannot hold above $69,000–$70,000, especially with increasing selling volume, the larger downtrend stays in control. The daily chart still shows lower highs, and moving averages are all pointing down. Rejection around this resistance zone could push price back toward $66,000, then $64,000, with $60,000 as the next key support. Until $72,000 is broken with strong conviction, any rally remains fragile inside the prevailing bearish trend.