Key points:
Bitcoin is trading in a key historical zone, but buyer pressure is too weak to break resistance.
Analysis sees the current range resistance potentially lingering for months.
February BTC price downside has almost beaten 2025.
Analysis: Bitcoin bulls too weak to crack $69,000
Data from TradingView put daily BTC price losses at nearly 3% after the $70,000 area again provided weak support.
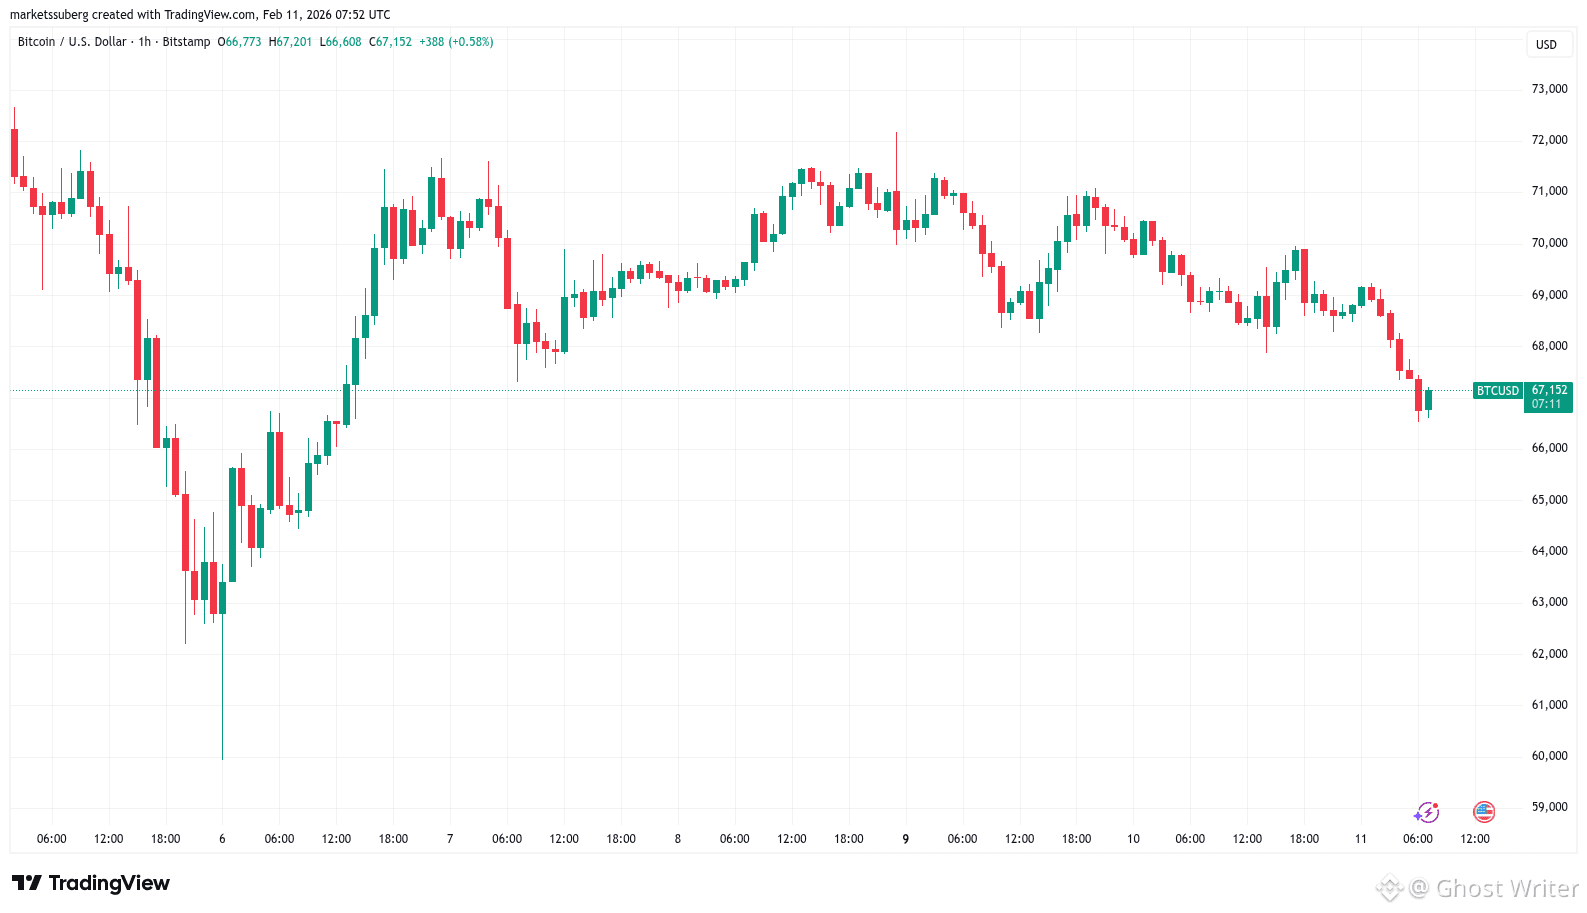
Still facing bottom predictions of $50,000 or lower, BTC/USD offered traders little reason to flip bullish.
Keith Alan, co-founder of trading resource Material Indicators, noted the importance of the current narrow trading range.
“$BTC continues to show signs of weakness around $69k, however, if you look back to 202,4 you will notice that price spent an extraordinary amount of time consolidating in this range,” he wrote in one of his latest posts on X.
“That 8 months of consolidation, coupled with the 2021 Top created structural strength at this level, and it's good to see the market acknowledging that.”
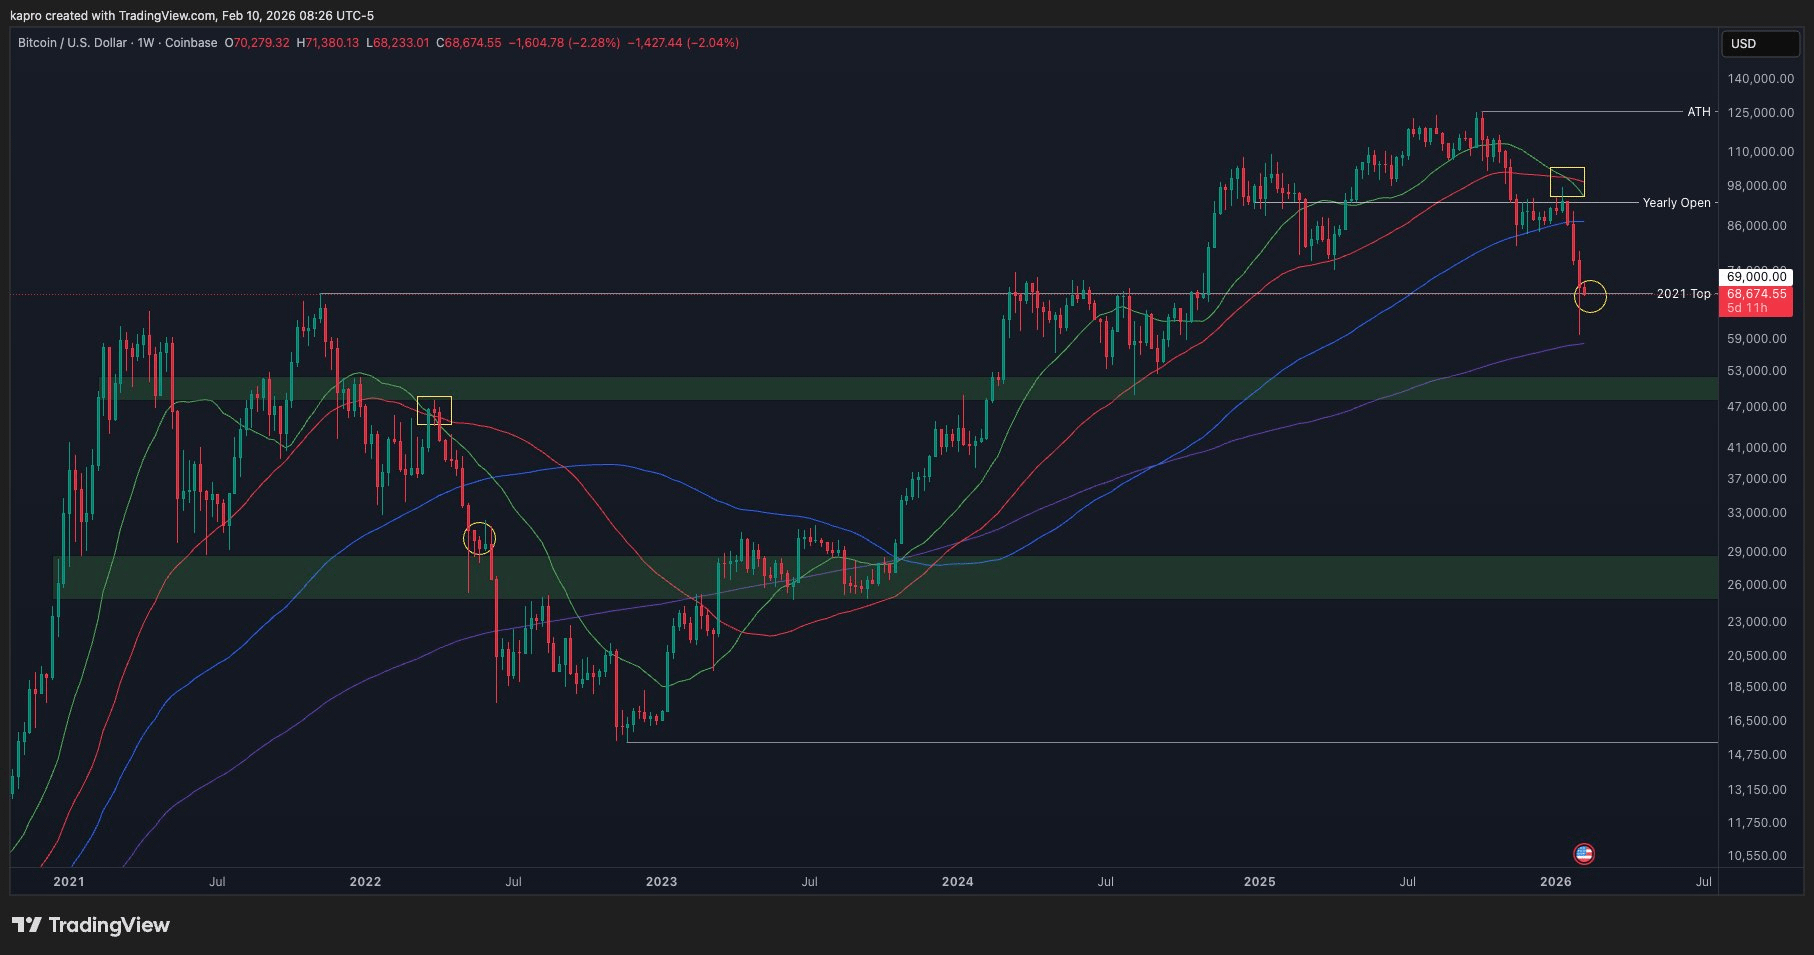
The significance of $69,000 means that it could act as a double-edged sword in the future.
“If a bullish catalyst emerges and triggers a recovery, we can conclude that the additional consolidation in this range, fortified structural support,” Alan continued.
“Likewise, if the downtrend extends from here as history (and the charts) suggests, resistance at this range will be even stronger than it was in 2024. That doesn't mean it will be impenetrable, it just means that it's going to take a lot of momentum to break it. At this moment in time, we aren't seeing enough momentum to do that in a sustainable way.”
BTC price eyes biggest February loss since 2014
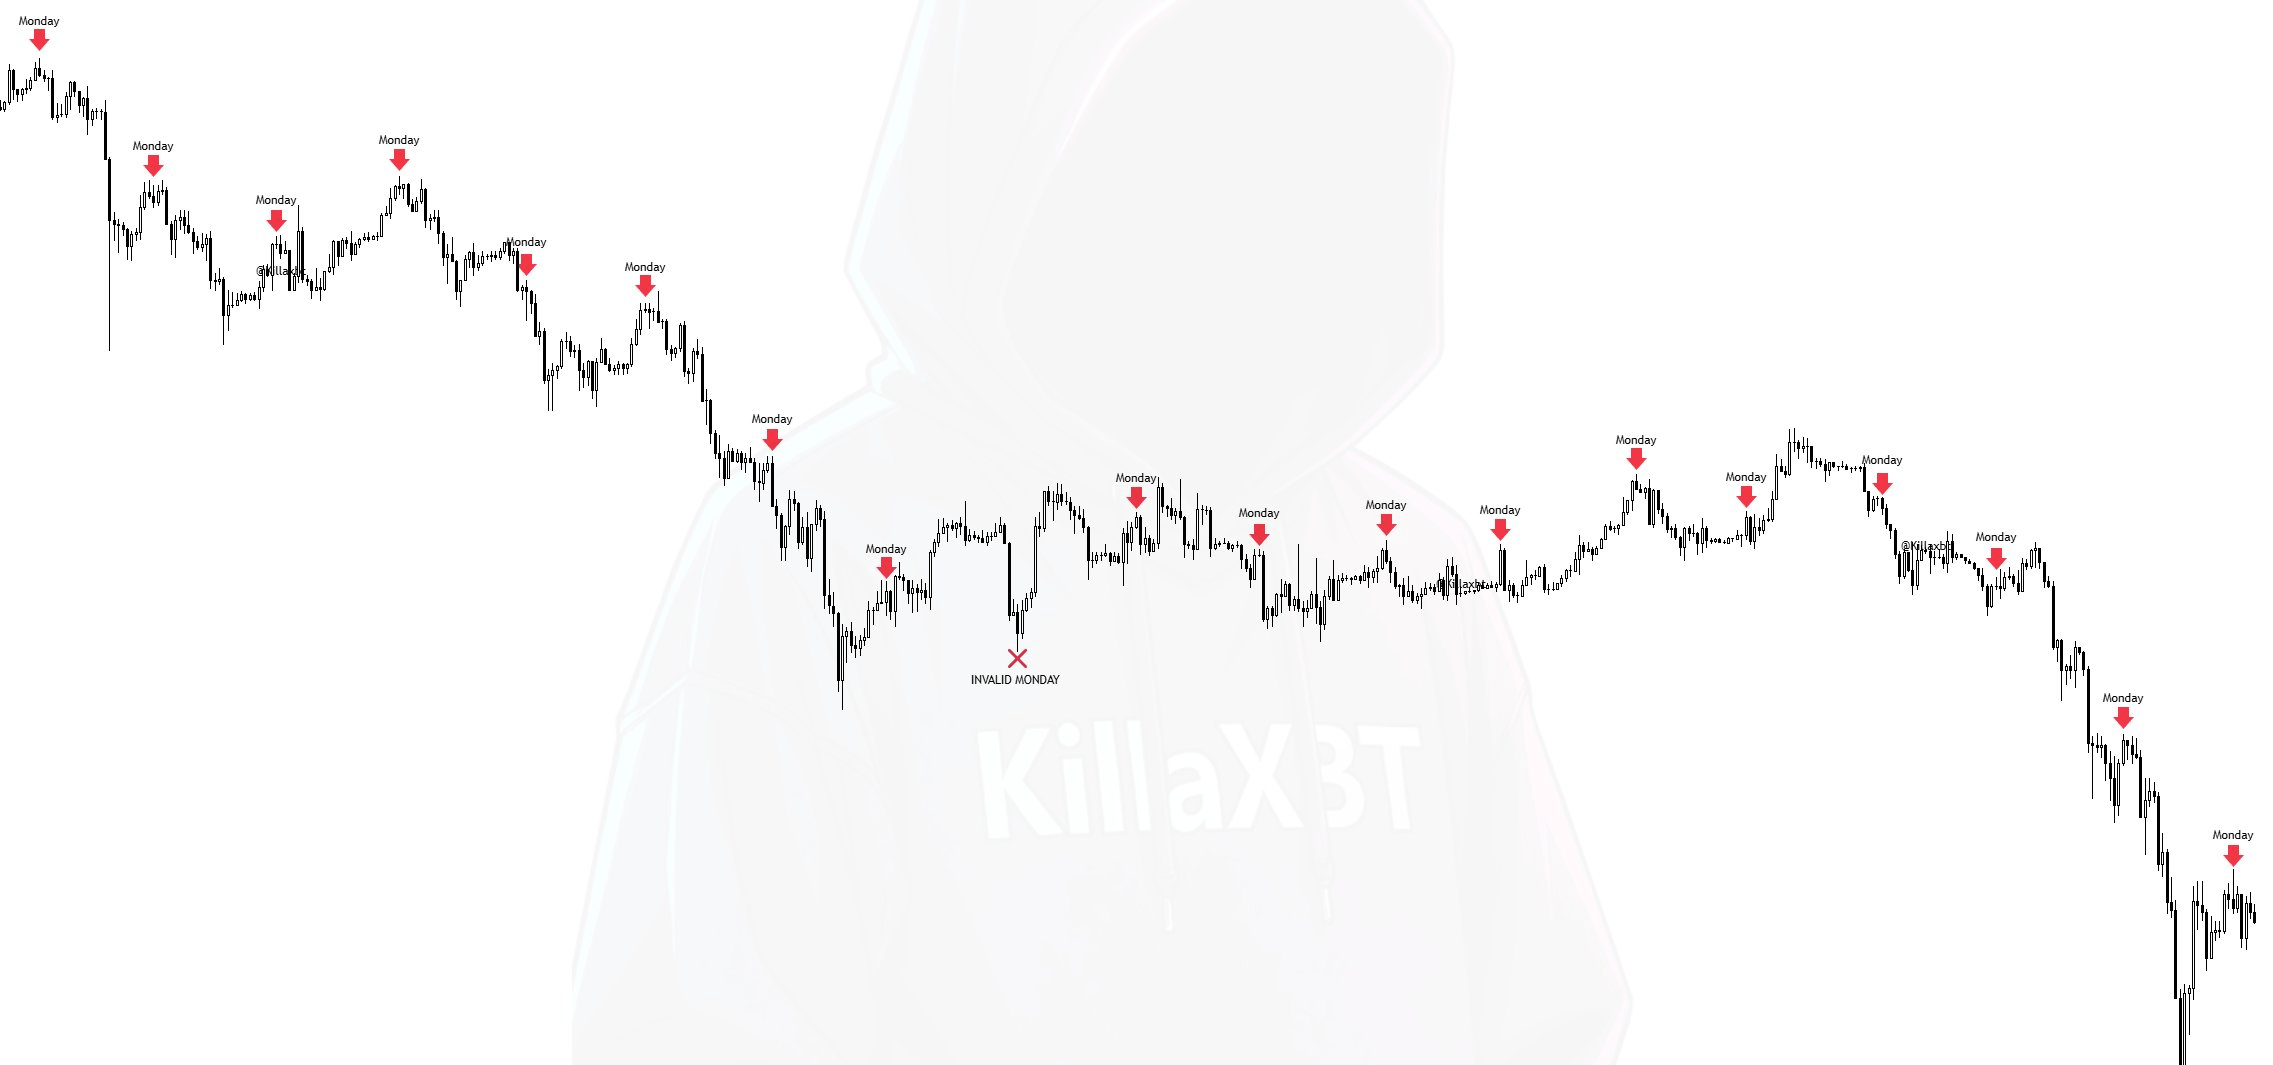
Mondays have been particularly lucrative for short positions since Bitcoin began breaking down from all-time highs in October 2025.
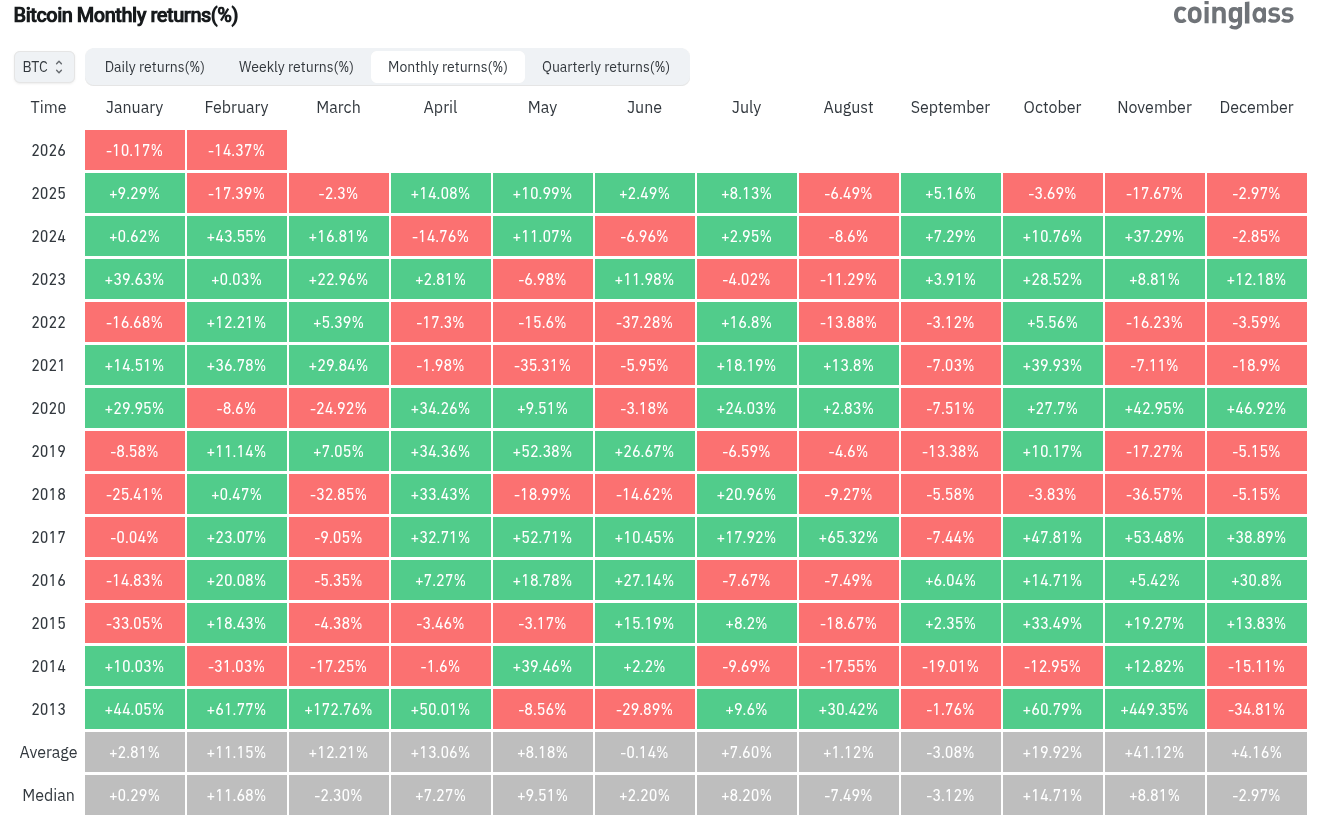
Data from monitoring resource CoinGlass shows that at -14.4%, Bitcoin’s February losses in 2026 are almost on par with last year’s performance. Still, since 2013, February has only ended in the red three times.