$BTC Chart Overview: The Savage DropYer
15-minute Binance chart shows Bitcoin divin' like a scuttled ship: Current price at $64,849.54, down -8.9% in the last 24 hours from a high o' $71,978.58 to a low o' $60,000. Volume's healthy at 125,338 BTC (~$8.25B USDT), with transactions hummin' along. The candlesticks paint a picture o' panic sellin'—a massive red candle droppin' from ~$67k to $60k, followed by green bounces but strugglin' under the declinin' MAs (MA7 at $65,483, MA25 at $65,057, MA99 at $66,942). Longer-term? Up 2.53% today but down -23.26% over 7 days, -30.43% in 30 days, and worse further out. This be a classic liquidity stress event, screamin' o' macro fears like weak jobs data and delayed rate cuts.
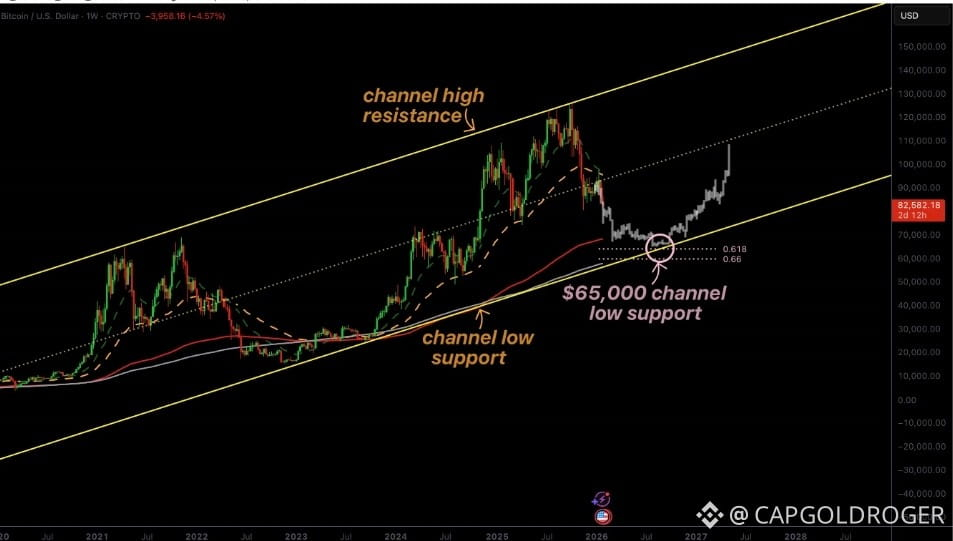
The Shift: From Dramatic Bear to Key Support Consolidation
Blimey, that bearish broadside was brutal! BTC crashed through multiple resistances, breakin' below $70k fer the first time since late 2024, wipin' out billions in a flash. Analysts call it a "market shock" driven by Vitalik's ETH dumps ($6.69M worth) and broader risk-off sentiment. But look closer: After hittin' the $60k abyss (a psychological and historical support, near the 200-week EMA), it's consolidatin' sideways in a tight range o' $60k–$65k. Volume bars spiked on the drop (fear sellin') but tapered off, suggestin' exhaustion. The MA lines are flattish now, with price bouncin' off the lower Bollinger Band—classic signs o' bears losin' steam and buyers testin' the waters. If we hold $60k, this could be the calm before the bull storm; a break below opens Davy Jones' locker to $52k–$58k.
Towards Bull Preparedness: Reversal Signals on the Horizon
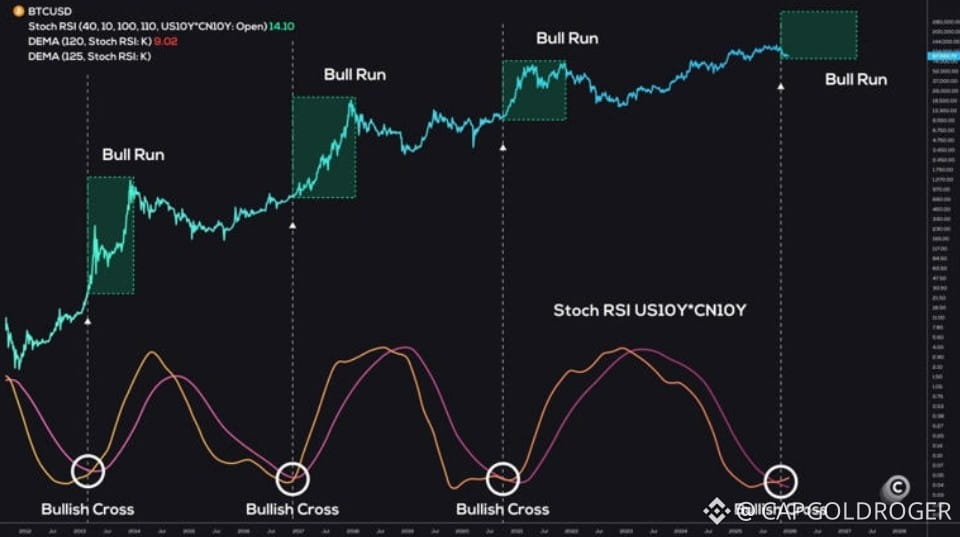
Aye, the winds be shiftin'! Despite the gloom, BTC's showin' bull readiness. The Stochastic RSI be oversold (near 0), hintin' at a rebound like past cycles where "bullish crosses" sparked runs. JPMorgan's turnin' bullish, raisin' long-term targets to $266k as BTC overtakes gold on volatility-adjusted basis. History shows post-halving dips like this (down 45% from $126k ATH) often precede peaks—think 92x gains after 2012 halvin'. If tomorrow's NFP jobs data surprises soft (boostin' rate-cut odds), or if Trump admin's crypto promises kick in, we could see a swift rally. Key watch: A close above $66k (MA99) signals bull control, targetin' $70k–$82k. But beware: Stifel warns o' $38k if supports fail. Me take? Preparedness high—stack sats here fer the cycle bottom in 2026.
Scalping Strategies: Quick Raids in the Chop
Fer ye short-term pirates, scalpin' this 15m chart be prime! Focus on range-bound action 'round $60k–$65k. Strategy: Use RSI divergences (oversold buys, overbought sells) with tight 1-2% targets. Long scalp: Buy at $62k support on green candle close, TP at $64k (near MA7), SL at $61k (below low). Short scalp: Sell at $65k resistance on red wick, TP at $63k, SL at $66k. Leverage low (1-5x) to avoid liquidation storms—aim fer 5-10 trades a day on high-volume spikes. Tools: Bollinger Bands fer squeezes, SAR fer trend flips. Risk 0.5% per trade; this consolidation's yer playground till breakout.
TP/SL Levels: The Full Arsenal
Here's a table o' key levels fer all horizons—TP fer profits, SL fer protection. Based on fib retracements from $60k low to $72k high, and current sentiment.
Timeframe | Entry/Buy Zone | Take Profit (TP) Levels | Stop Loss (SL) Levels | Risk/Reward Ratio
· Scalp (15m-1h) $62,500–$63,000 TP1: $64,000 TP2: $65,000 SL: $61,500 (tight) 1:2
· Swing (1d-7d) $60,000–$62,000 (key support) TP1: $66,000 (MA99) TP2: $70,000 TP3: $82,000 (weekly close target) SL: $58,000 (below 200w EMA) 1:3
· Long-Term (1m+) Accumulate under $65,000 TP1: $100,000 (2026 prediction) TP2: $126,000 (ATH retest) TP3: $266,000 (JPMorgan LT) SL: $52,000 (ultra-bear) 1:5+
There ye have it, A Captains—a full broadside analysis from bear plunge to bull horizon. The shift's real, but patience be key; don't chase the dip without SLs.
Just fer ye scallywags me going in Long-term