Summary
Markets experienced a liquidity-driven selloff last week triggered by Fed Chair nominee Kevin Warsh's aggressive balance-sheet reduction stance, with crypto assets acting as "end-of-liquidity-chain" holdings that were sold first to meet margin calls across traditional portfolios.
Bitcoin broke critical technical support levels near $73K and leverage metrics remain elevated above historical averages, signaling the deleveraging process is underway but not yet complete.
However, markets may be overpricing QT risks given that the financial system's "plumbing constraints"—particularly depleted reverse repo facilities and the Treasury's $2T annual funding needs—could physically prevent aggressive balance-sheet shrinkage, while the overlooked end of the US government shutdown removes a near-term policy uncertainty overhang.

Market View
The market experienced severe turbulence for the past week, with risk assets under broad pressure. The nomination of Kevin Warsh as the next Federal Reserve Chair has sparked concerns about liquidity tightening, triggering large-scale deleveraging. cryptos, positioned at the end of the liquidity chain, bore the brunt of this adjustment. Technically, Bitcoin has broken below key support levels, with market sentiment turning cautious. However, the resolution of the U.S. government shutdown provides a positive signal, and medium to long-term liquidity concerns may be overblown.
I. Market Liquidity Crisis Analysis
1.1 Characteristics of Forced Liquidation Selling
The past week's market exhibited classic "liquidity crisis" characteristics. Following Microsoft's disappointing earnings that triggered a tech stock selloff last week, plus mid-east tension rises and new ‘hawkish’ Fed chair nomination, traders faced massive margin pressure and were forced to "sell winners" to raise cash to cover losses.
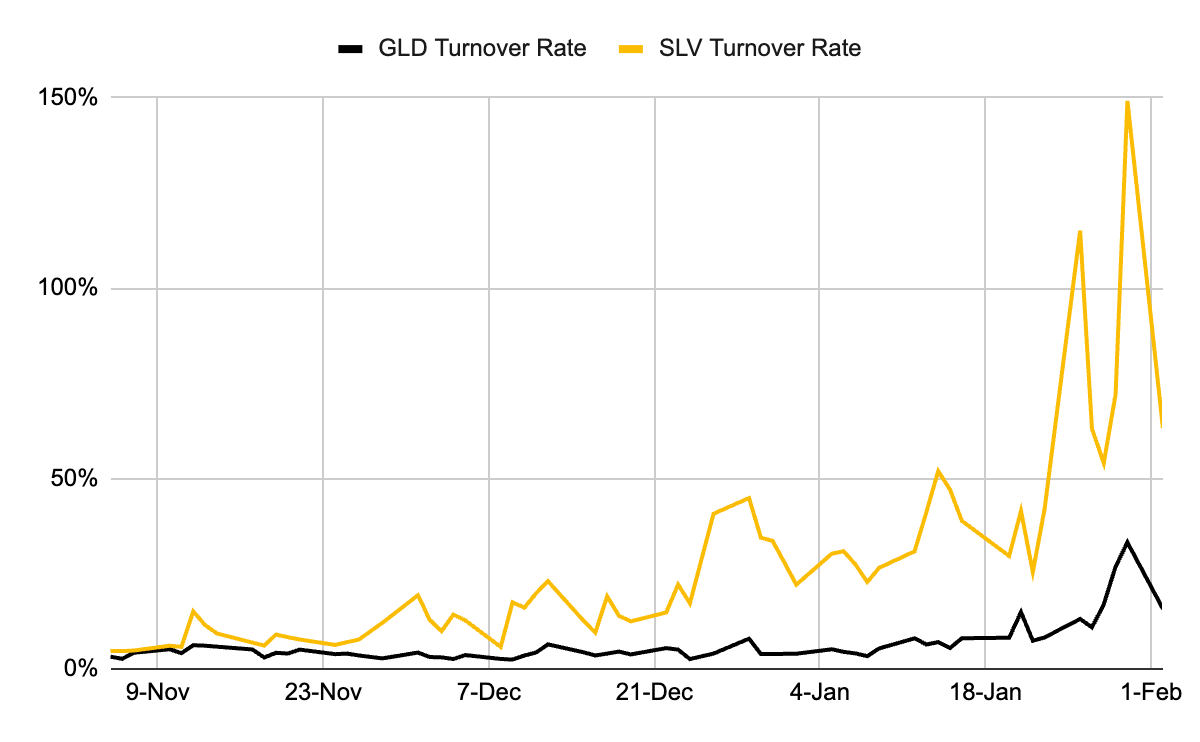
Precious Metals Market Anomalies:
Gold and silver ETF (GLD+SLV) trading volumes exceeded $40 billion for two consecutive days, representing over 10 times normal daily levels
Turnover rates reached historical highs, indicating a stampede exit from crowded long positions
Figure 1: GLD+SLV Trading Volume & Turnover Rates Spike to Historic Highs
U.S. Dollar and Treasury Markets:
The U.S. Dollar Index (DXY) rebounded strongly from last week's low of 95.55 to approximately 97.5, recovering most of its losses
The Treasury yield curve steepened, reflecting market repricing toward a return to "sound money" monetary policy
1.2 Intensifying Structural Divergence in Equity Markets
Earnings season performance has been highly divergent, with the market experiencing unprecedented sector polarization:
Beneficiaries:
Large tech companies like META and Apple reported strong revenue figures
Semiconductor companies are viewed as core beneficiaries of the AI super-cycle
Casualties:
Microsoft plunged over 10% due to flat Azure growth
Software companies collectively under pressure, with markets concerned that AI will erode traditional SaaS companies' competitive moats ( e.g., Anthropic's newly released Agentic Cowork facility sparks fear of lots professional software services companies)
1.3 Cryptos at the End of the Liquidity Chain
Crypto market performance confirms its position in the financial system's liquidity hierarchy:
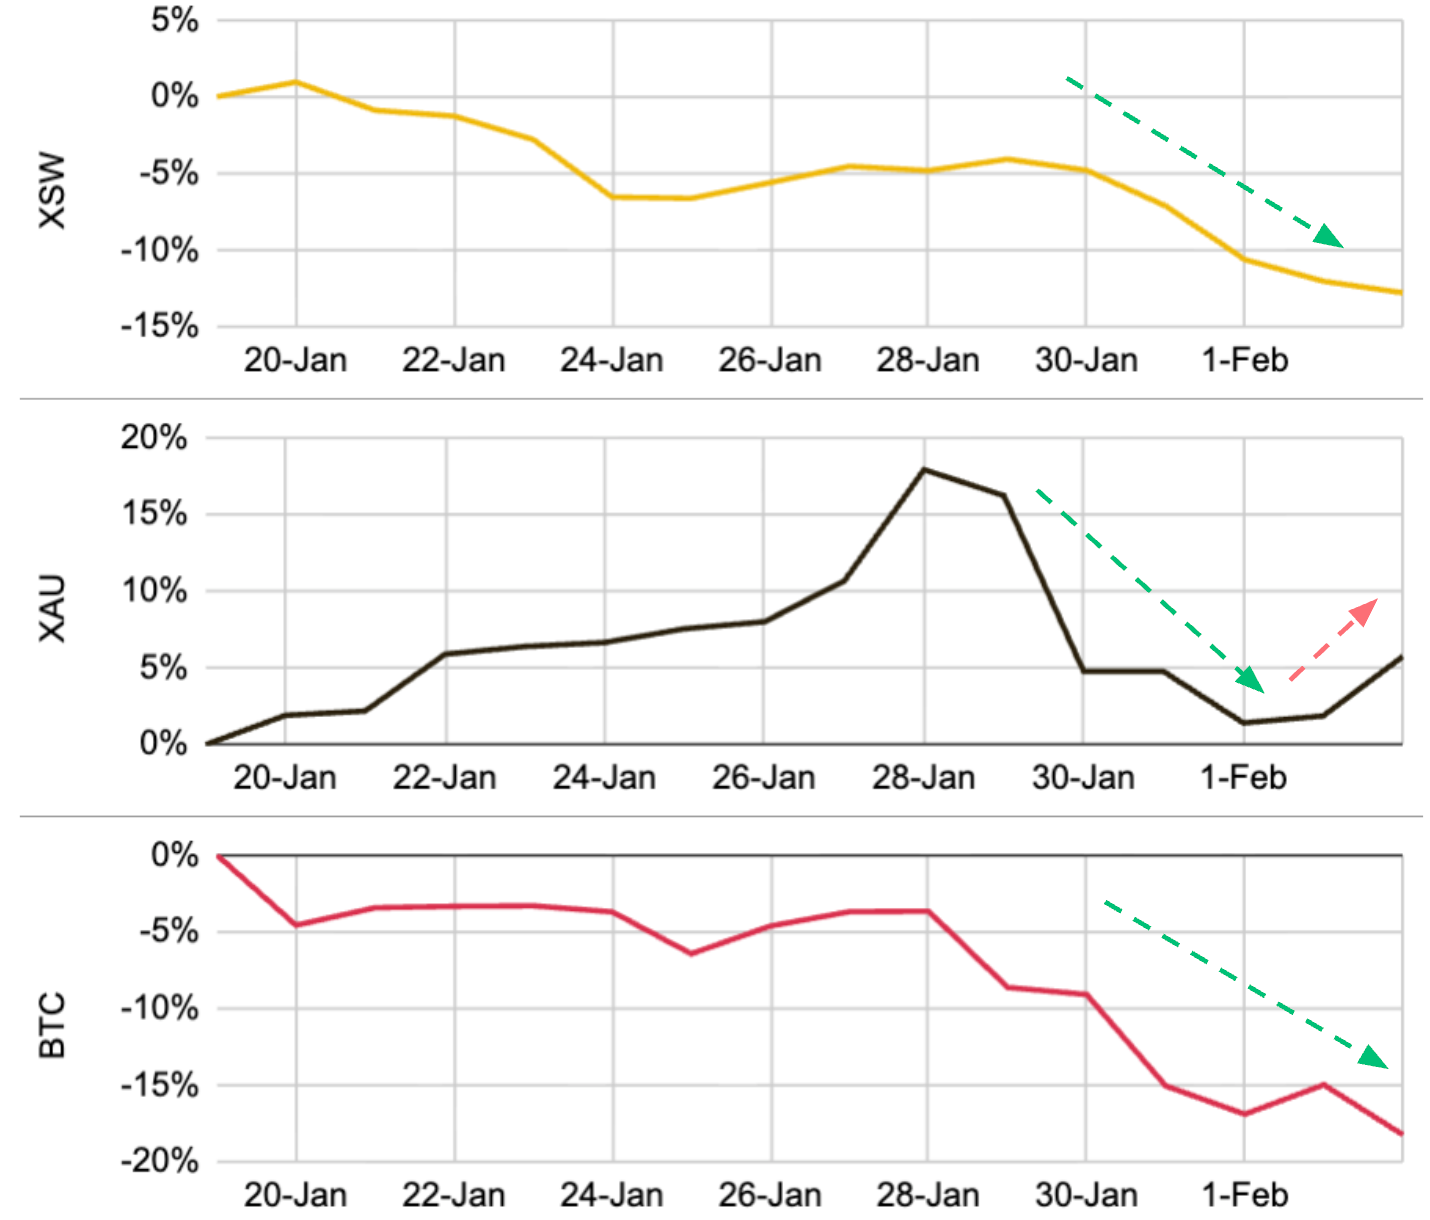
When precious metals crashed, cryptos fell in tandem
When precious metals rebounded, cryptos continued declining alongside software stocks (we use XSW-SPDR S&P Software & Services ETF as proxy in Figure 2)
Conclusion: cryptos currently sit at the very end of the financial liquidity system, and any major asset decline leads to crypto being sold first to raise liquidity
Figure 2: Recently, Crypto Tend to Follow Any Major Asset Decline Ignore Their Subsequent Rebounds
1.4 Technical Breakdown:
Bitcoin touched an intraday low of $72,950 on Wednesday (Feb 4), the lowest level since November 2024. It has broken below the head-and-shoulders neckline and both the 100-day/200-day moving averages, and pierced last April's low. The next key support level is at $70,000 - this was a head formation tested multiple times throughout 2024, and it only broke out in November when the probability of Trump's election victory increased
II. Crypto Microstructure: Deleveraging Is Underway
2.1 “Aggregated leverage ratio” remains elevated
Using an industry leverage proxy defined as:
(Futures Open Interest + Options Open Interest + On-chain total borrowings) / BTC Total Market Cap
Figure 3: BTC Aggregate Leverage Ratio
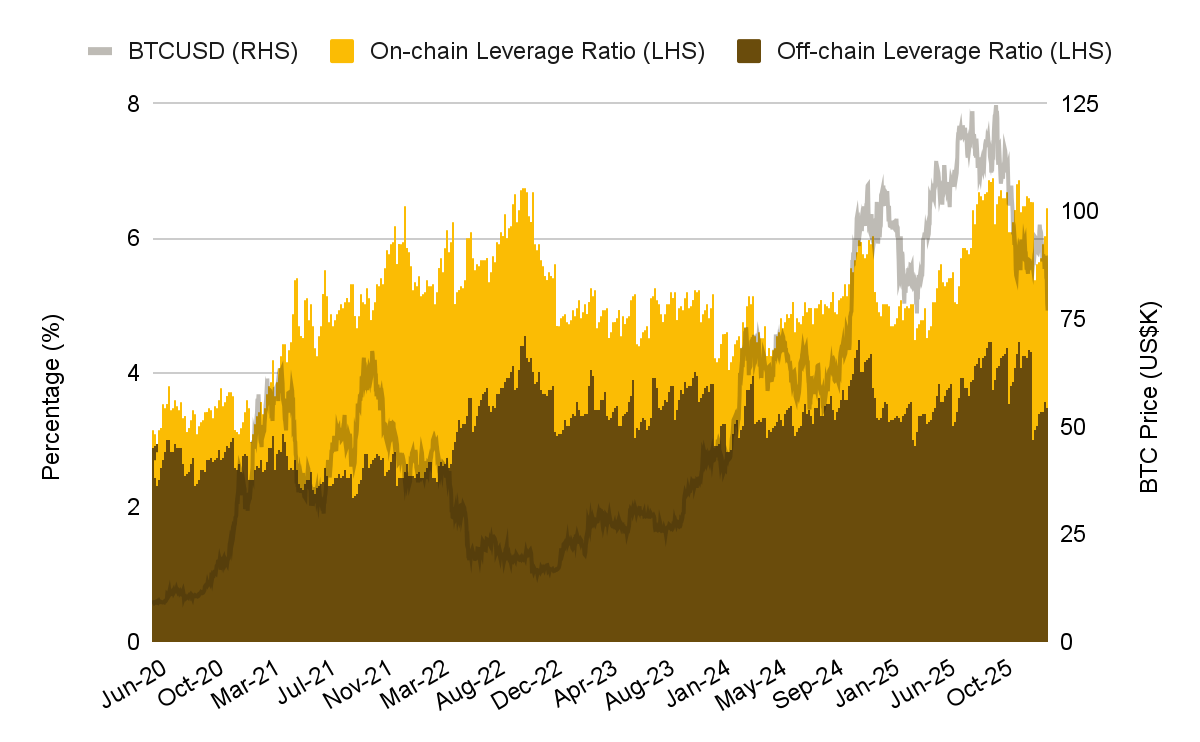
We can see:
5-year average: ~4.88
Current level: ~5.8
This suggests the market is deleveraging, but overall leverage is still high relative to history—meaning conditions do not yet resemble the “nobody cares anymore” despair often seen at major cyclical bottoms.
2.2 Derivatives positioning and selling pressure signals
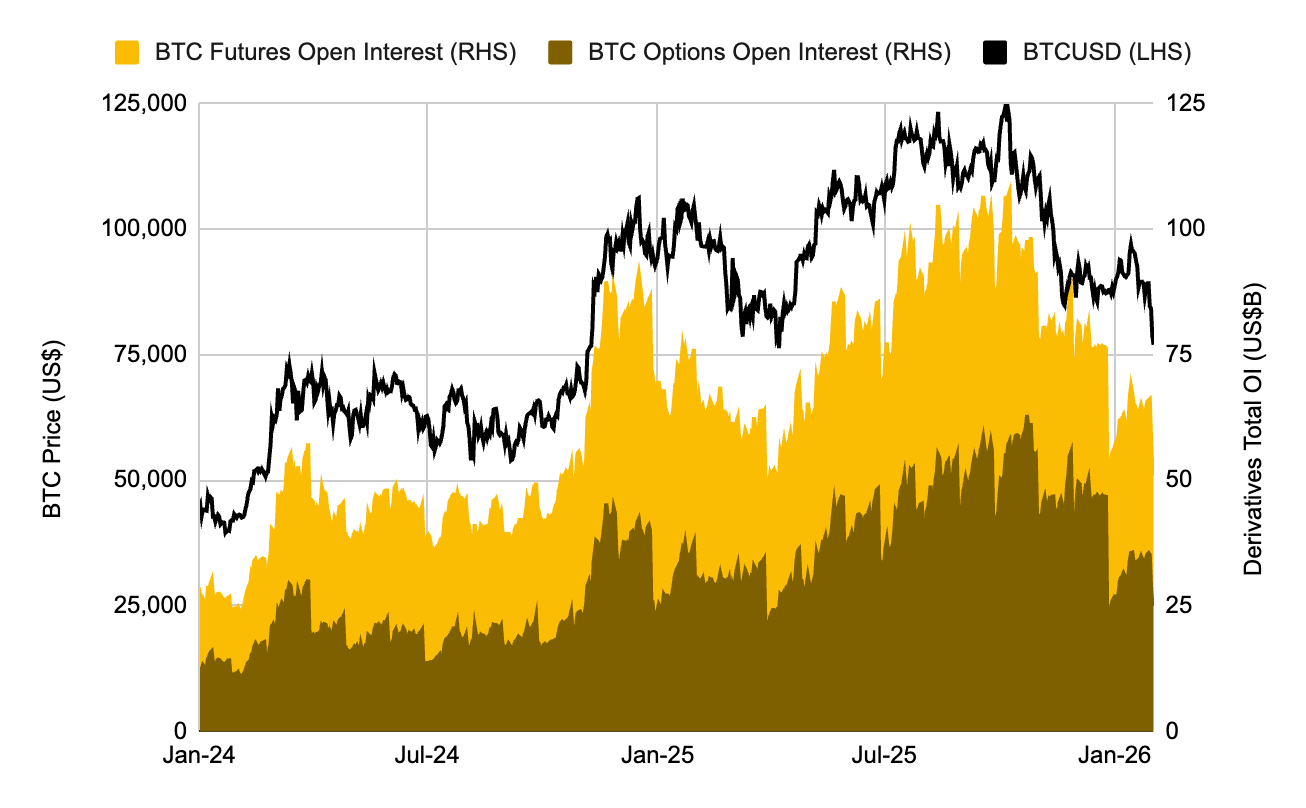
Derivatives open interest had previously dropped sharply (from ~US$76B to ~52B) due to large contract year-end expiries, which helped set up the early-2026 rebound as traders rebuilt leverage. With the recent selloff, that re-leveraging momentum has stalled.
Figure 4: BTC Total Open Interest of Futures and Options
In addition, several market structure indicators point to continued selling pressure:
Spot price above perpetual price (a futures discount) suggests bearish positioning/expectations.
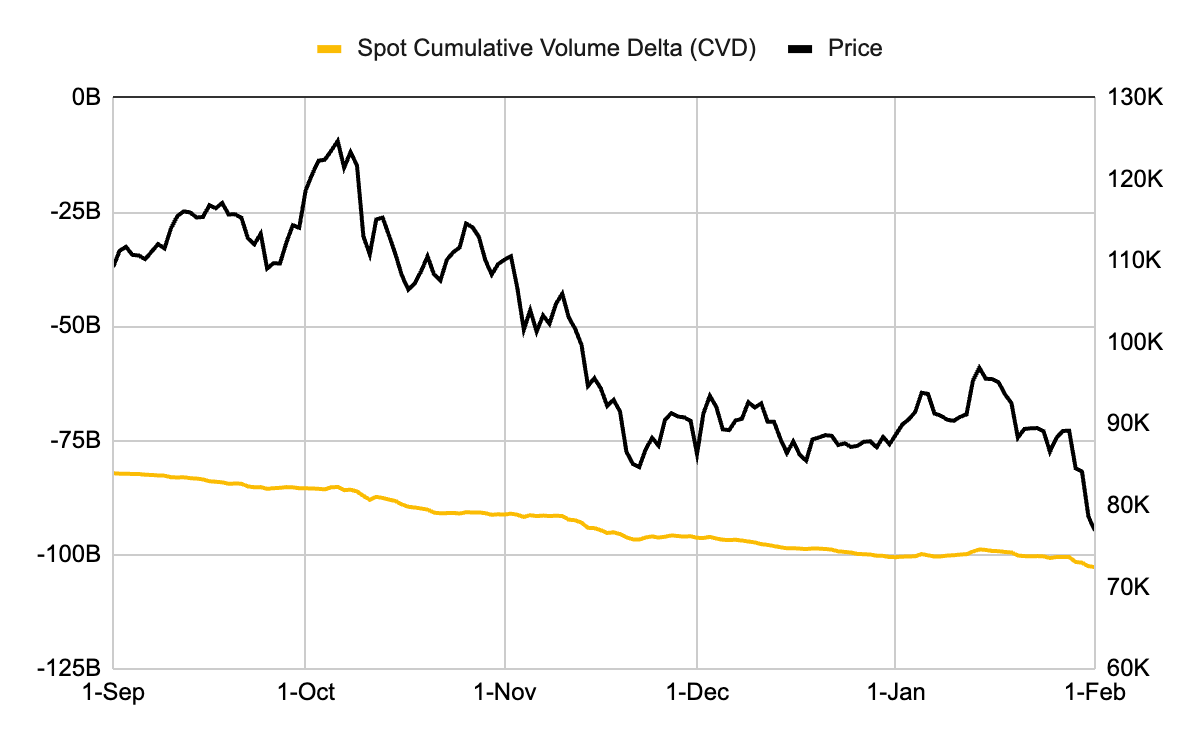
Declining spot CVD (cumulative volume delta) indicates net selling in spot flows.
Figure 5. Spot-Perp Gap
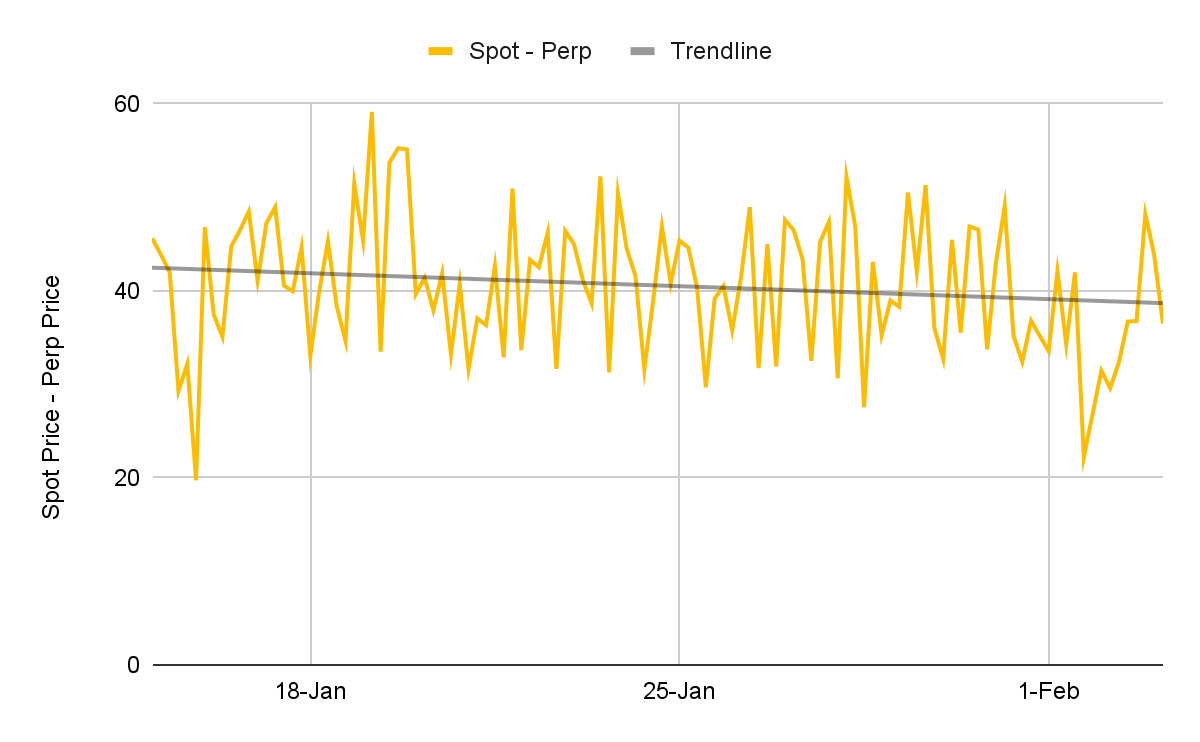
Figure 6. BTC Spot CVD
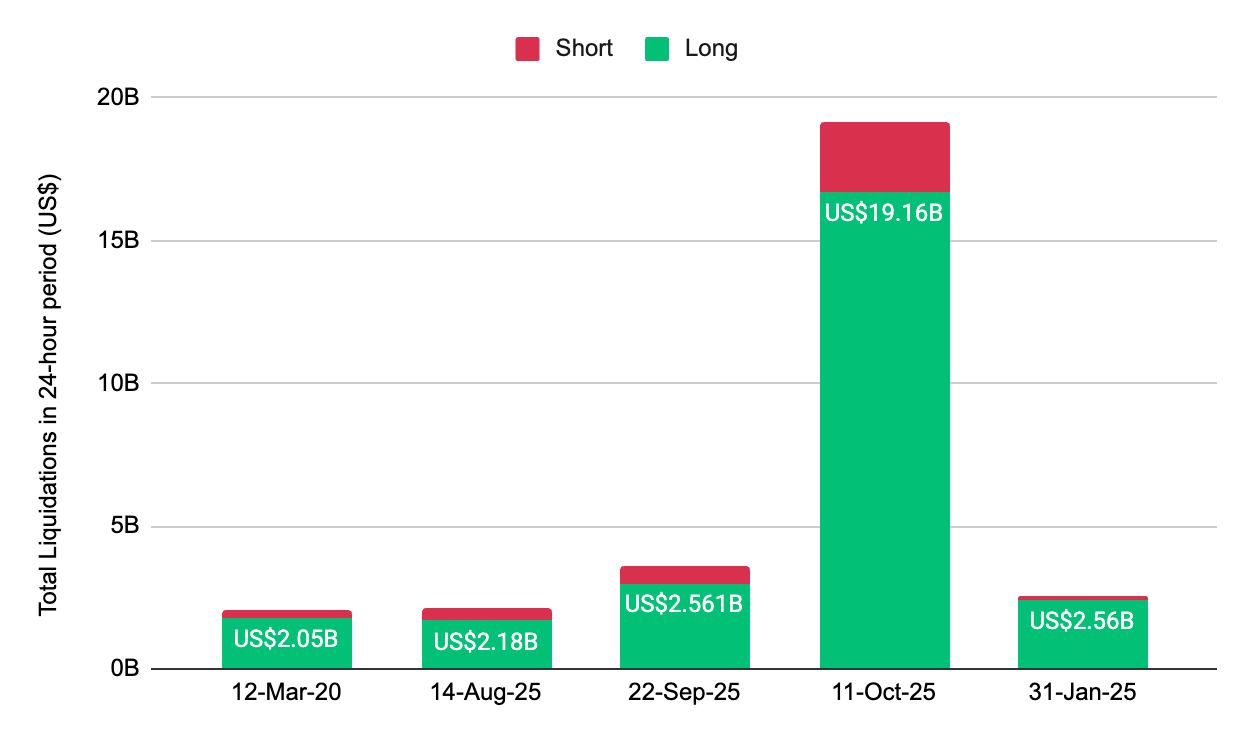
2.3 Historical Context: Left-Tail Risks & The "Fat Right Tail
On January 31st, single-day crypto futures liquidations reached $2.56 billion. Historically, daily crypto liquidations exceeding $2 billion have been rare—this marks only the fifth occurrence on record.
Analyzing the previous four instances reveals an interesting pattern: while mean returns are positive across all time windows, the median is negative in most cases. This divergence is largely driven by the exceptionally strong 2020 rebound, which significantly skews the average upward. The data suggests that in most cases, a major liquidation event is not a reliable "market bottom" signal. At least over the 30–60 day horizon, the more common pattern is:
Short term (1–2 weeks): The market typically enters a repair/consolidation phase with no clear directional bias.
Medium term (1–2 months): Price action tends to continue weakening, with the median drawdown reaching -10.26%.
In summary, left-tail risk remains substantial, but the right tail is fat: most of the time, returns are flat to negative, yet when a rebound does materialize, the upside can be significant.
Figure 7: BTC price Change after single day liquidation >US$2B
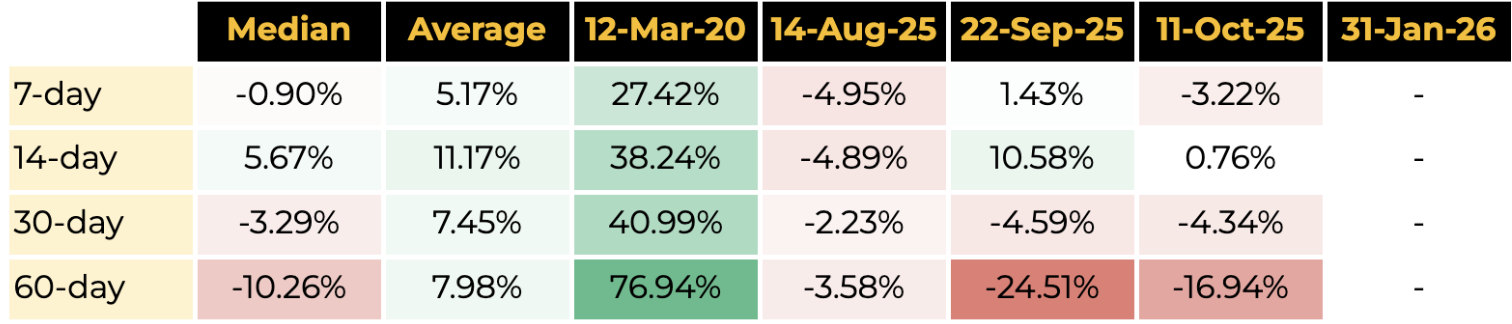
Figure 8: Top five liquidation in the history
III. Retail Participation: Noticeable Cooling
Deutsche Bank's latest survey reveals a sharp drop in U.S. crypto adoption rates, which may give us more background of recent market sentiment:
Ages 18–34: adoption fell from 24% (Jan 2025) to 18% (Dec 2025)
Middle-aged group: 22% → 15%
Figure 9: Crypto Adoption Rates by Age Group in U.S. and Europe (December 2025 vs January)
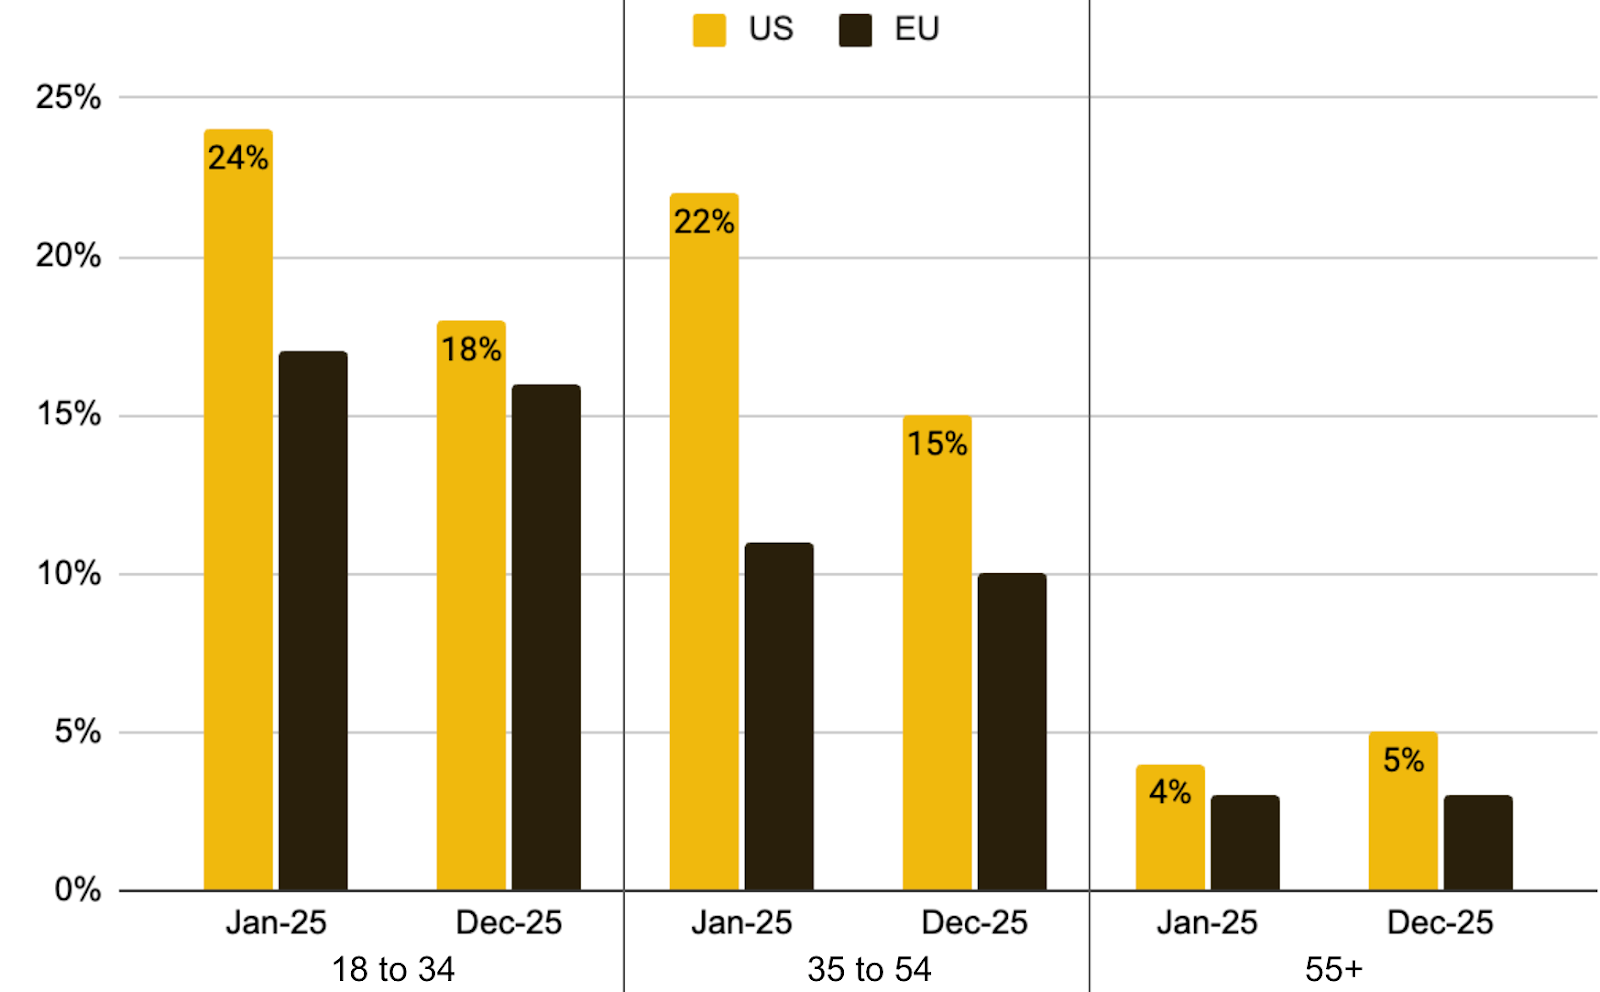
18-34 age group: Declined from 24% in January 2025 to 18% in December
Middle-aged group: Dropped from 22% to 15%
Contributing Factors:
Bitcoin's second-half crash damaged retail confidence
Strong performance in traditional assets (stocks, gold) diverted capital flows
III. Kevin Walsh’s Policy Proposals and Possible Market Overreaction
3.1 Catalyst for the Current Selloff
The trigger for this round of market decline, besides the geopolitical risks in the Middle East (the armed conflict between the U.S. and Iran has not actually occurred, and recently both countries are moving toward negotiations), is the nomination of the new Federal Reserve Chair. Although he has recently advocated for rate cuts, he was known as an “inflation hawk” early in his career. Despite his proposals to restructure the long-standing establishment-led monetary policy framework—which aligns with Trump’s political narrative of “breaking the old and establishing the new”—he advocates for aggressive reduction of the Fed’s bond holdings. These uncertainties have made the market nervous, triggering risk position reductions.
In particular, if he aggressively shrinks the balance sheet after taking office, it could offset the easing effect of rate cuts and put pressure on risk assets, including cryptocurrencies. Therefore, the market’s reaction to Walsh’s nomination was sharp and immediate.
Just weeks before the news of Walsh’s nomination broke, the S&P 500 index and margin balances rose in sync to historic highs, indicating that every new market high was inevitably built on excessive leverage. The traditional market is now “precariously perched at the top.”
Figure 10: The Ratio of U.S. Stock Market Margin to M2 Continues to Climb to Historic Extreme Levels
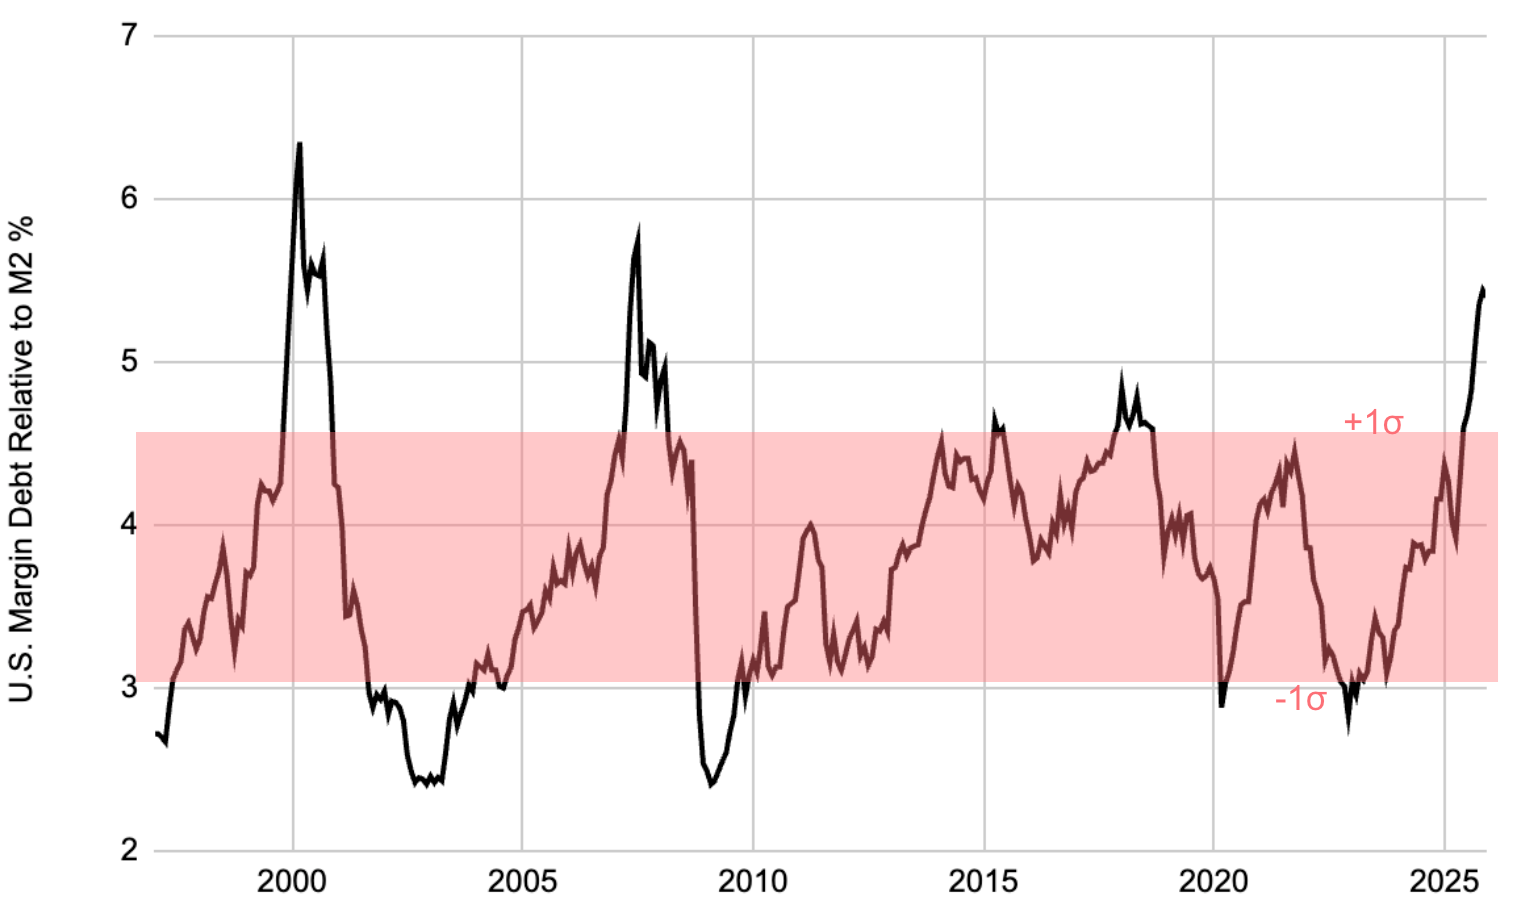
When Walsh’s balance sheet reduction proposals threaten liquidity supply, highly leveraged accounts are the first to receive margin calls. To raise cash, investors are forced to sell their most liquid or least cash-flow-generating assets at any cost (such as large-cap tech stocks, gold, and cryptocurrencies without cash flow), resulting in widespread asset declines.
3.2 Technical Constraints on Balance Sheet Reduction
Mainstream media interpret this as market fear of a “hawkish” administration. However, we need to note the contradictions in Walsh’s policies: the Fed can announce rate cuts by administrative order, but “balance sheet reduction” (QT) is physically limited by the market’s liquidity capacity. Without fundamental rule changes, the current financial “pipeline” cannot support balance sheet contraction.
Figure 11: The Federal Reserve’s Balance Sheet Must ‘Balance’
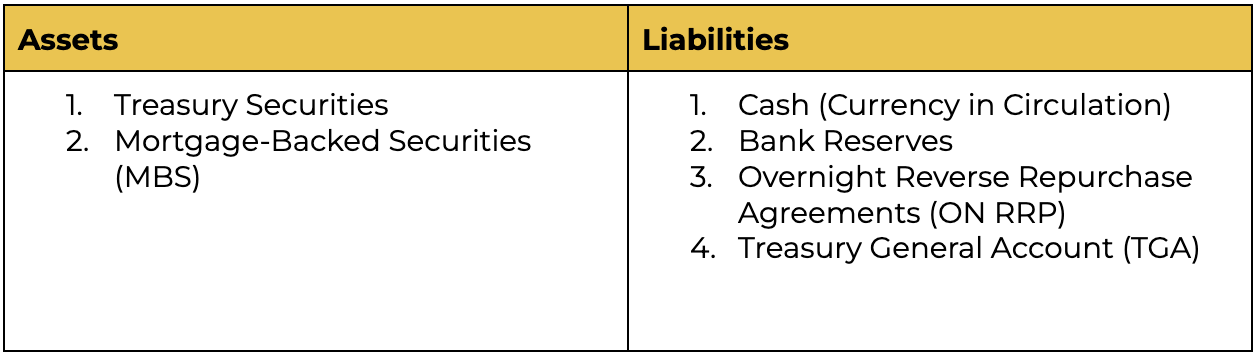
When the Fed conducts QT, it chooses not to roll over maturing Treasuries on the asset side, reducing assets. According to accounting identity, liabilities must also decrease accordingly. Since the demand for “cash” is rigid (slowly growing) and the TGA must maintain daily operations and not be controlled by the Fed, the only liabilities that can be reduced are bank reserves or ON RRP.
During the 2023-2024 QT period, there was a buffer: money market funds (MMFs) withdrew funds from ON RRP to buy new Treasuries. At that time, the reduced liability was ON RRP, not bank reserves, so banks did not feel the pain.
In 2026, the buffer is gone: ON RRP is nearly depleted (close to zero). Now, when the Treasury issues new debt, only commercial bank reserves can cover it. This means every dollar of QT is forcibly withdrawn directly from the banking system’s “lifeblood” (reserves).
When reserves fall below the regulatory red line (LCLoR, the minimum comfortable level), banks will stop lending to protect themselves, causing repo market rates to soar. Forced QT could thus trigger a repeat of the 2019 repo crisis or even a financial crisis.
Figure 12: ON RRP Buffer During 2023-2024 QT vs. Near Zero Today
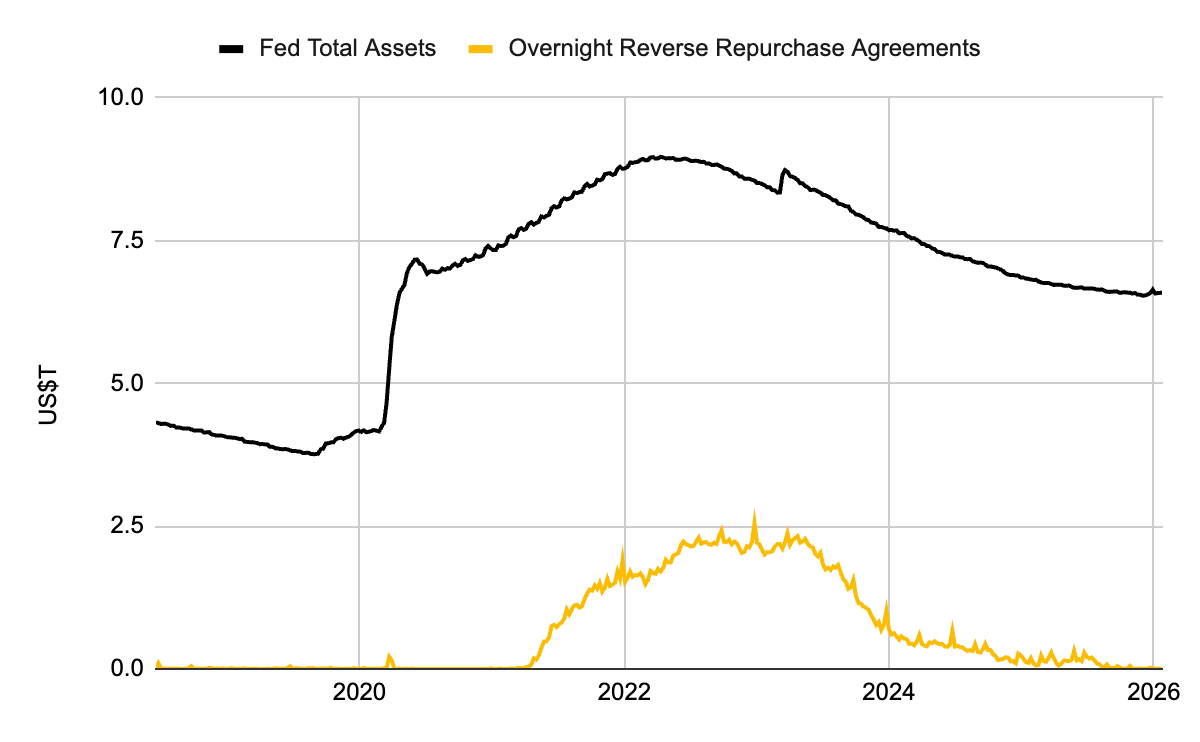
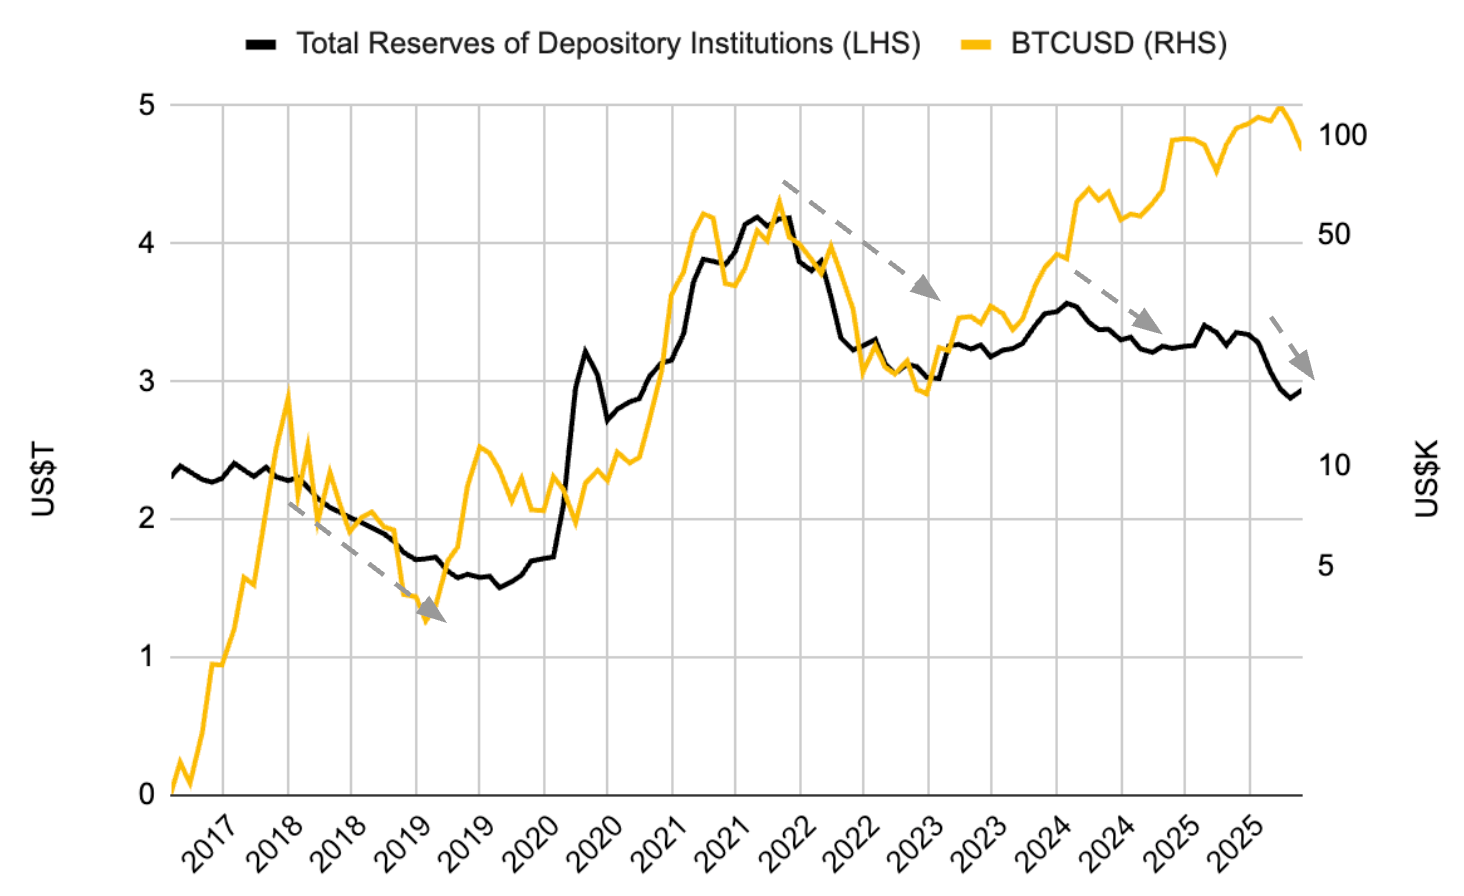
Figure 13: Bitcoin Tend to Face Greater Pressure During Periods of Significant Bank Reserve Declines
Additionally, Walsh’s QT plan is constrained by the U.S. Treasury:
The U.S. federal deficit rate in 2026 is expected to remain between 4.3% and 5.5% of GDP, meaning the Treasury needs to issue about $2 trillion in new debt annually.
If the Fed (formerly the largest buyer) becomes a net seller (QT) while the Treasury continues heavy issuance, the private sector must absorb this supply, which could lead to a bond market crash.
Potential Solution (Long-term):
In theory, to solve the “who will buy U.S. Treasuries” problem, the key is to revise banking regulations to relax risk requirements on Treasury collateral, enabling Treasuries to shift from the Fed’s balance sheet to commercial banks’ balance sheets.
If Walsh and his team can modify the rules and announce that “reserves and Treasuries will no longer count toward the SLR denominator” (SLR exemption), it could free up $4 trillion in bank capacity to absorb Treasuries. This would merely be a reshuffling of Treasuries and would not trigger a liquidity crisis. However, this is likely a post-2027 development and does not require much interpretation in the short term.
IV. Policy Development Tracking
4.1 Government Shutdown Risk Resolved (Positive Development)
Important but Overlooked Positive News:
The partial U.S. government shutdown (January 31 - February 3) has ended
The House passed funding legislation on February 3, signed by President Trump
Except for the Department of Homeland Security (DHS temporarily funded through February 13), all federal agencies are now fully funded through September 30, 2026
Significance: No "government shutdown" concerns for the remainder of the year. After the recent two shutdowns that caused market turbulence, this is the stability signal markets have been waiting for.
4.2 Slow Progress on Crypto Market Structure Legislation
White House Meeting (February 2):
Included representatives from crypto industry and traditional banking
No consensus reached, but direction described as "constructive" and "solution-oriented"
Emphasized need to resolve stablecoin yield disputes by month's end
Legislative Obstacles:
Unified Democratic opposition in the Agriculture Committee
Closed-door meeting held Wednesday (possibly to align internal positions)
High political sensitivity in 2026 midterm election year
Bill requires passage through Banking Committee and 60 Senate votes (including at least 10 Democrats)
Positive Signals:
Some Democrats (such as Booker) expressed willingness to find common ground, acknowledging that "inaction is not an option" and committing to "roll up sleeves and do the hard work" to ensure legislative progress doesn't punish innovators.
Market Pricing:
Prediction markets price the Clarity Act's passage within the year at 62% probability, improved from the year-start low of 40%.
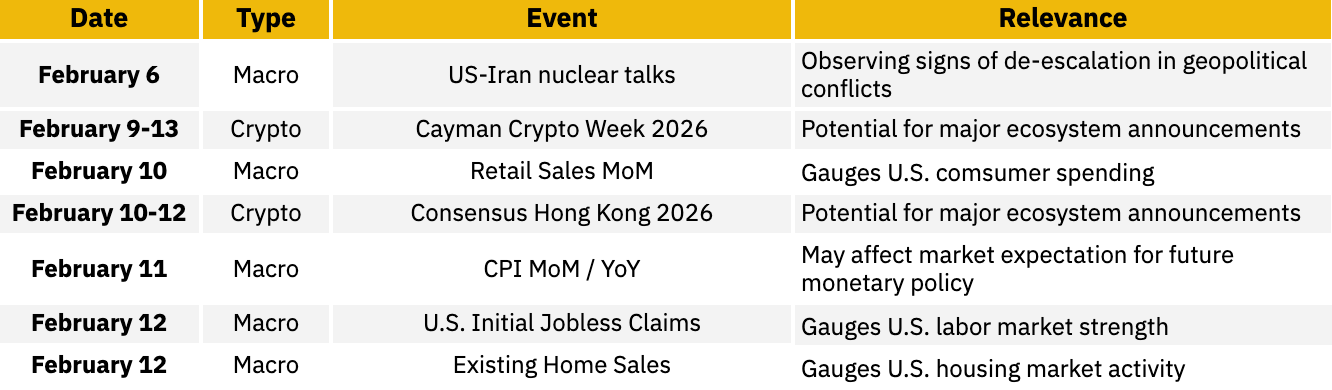
The Week Ahead
Although the U.S. government has reopened, the release date of the January Non-Farm Payrolls report remains unclear. As the most important recent employment data indicator, this adds some uncertainty for the market in assessing Federal Reserve policy.
Figure 14: Key macro and crypto events for the week of February 6-13, 2026
Performance Snapshot
Figure 13: YTD indexed performance – major digital assets
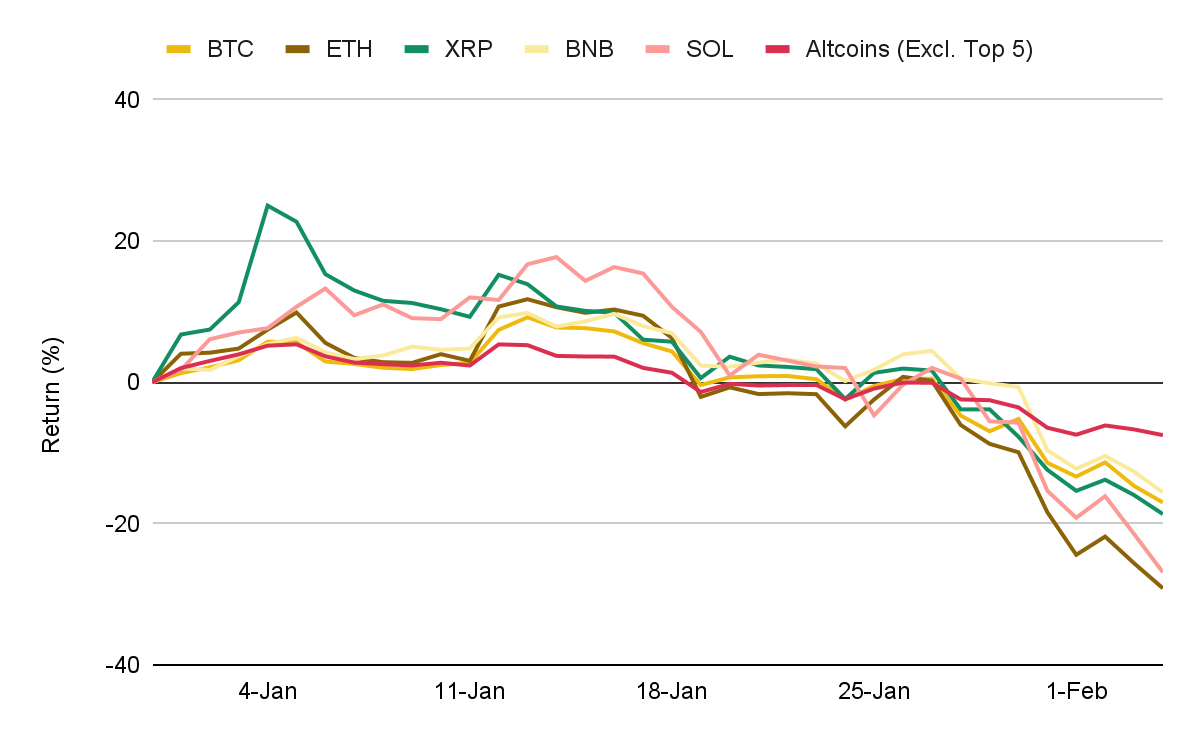
Figure 14: Multi-asset performance – equities, FX, commodities, bonds, volatility
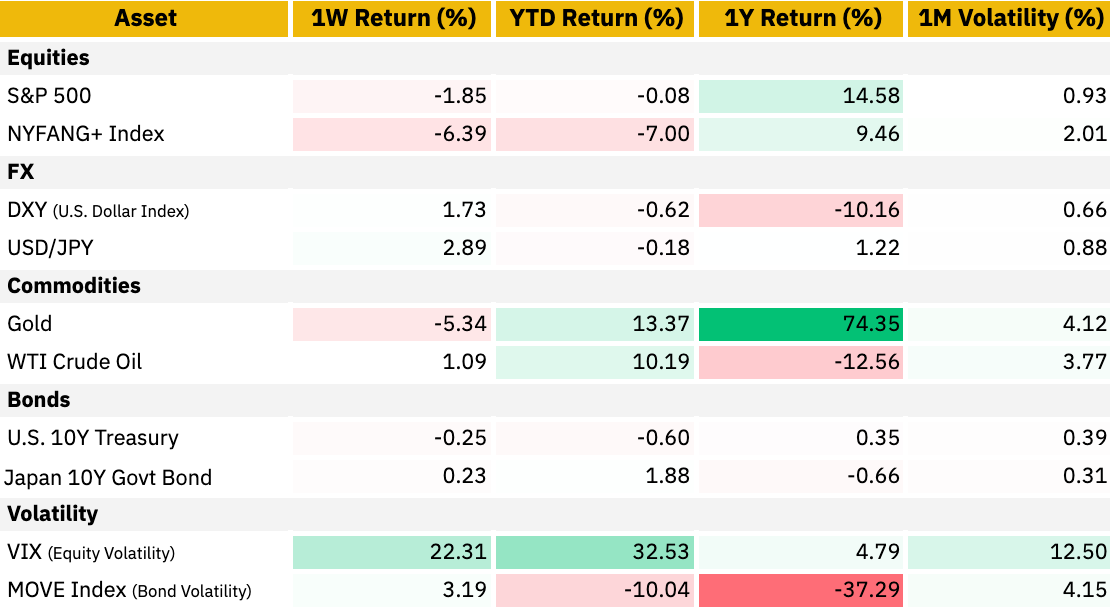
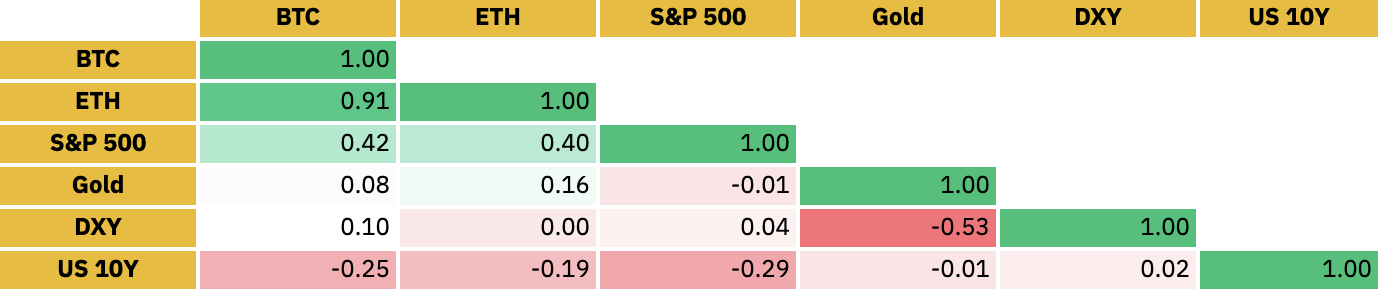
Figure 15: Crypto sectors’ relative performance vs BTC
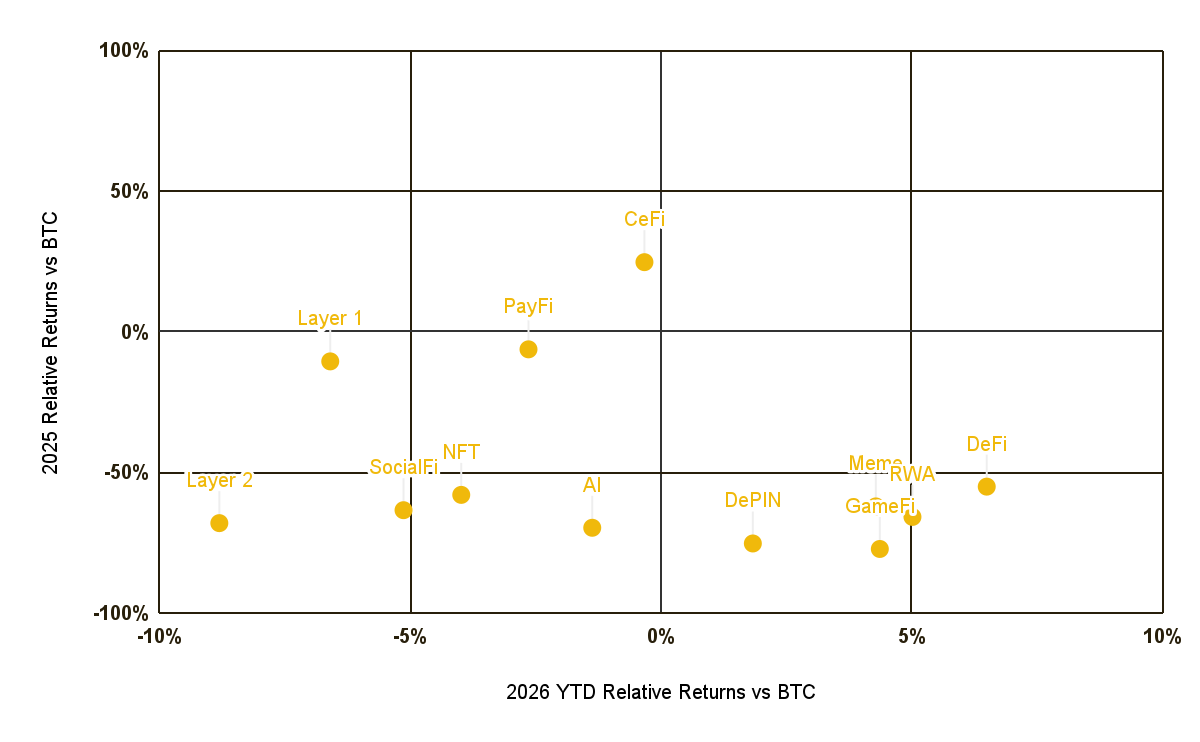
Figure 16: BTC 2M Correlation Matrix (vs ETH, S&P 500, Gold, DXY, US 10Y)