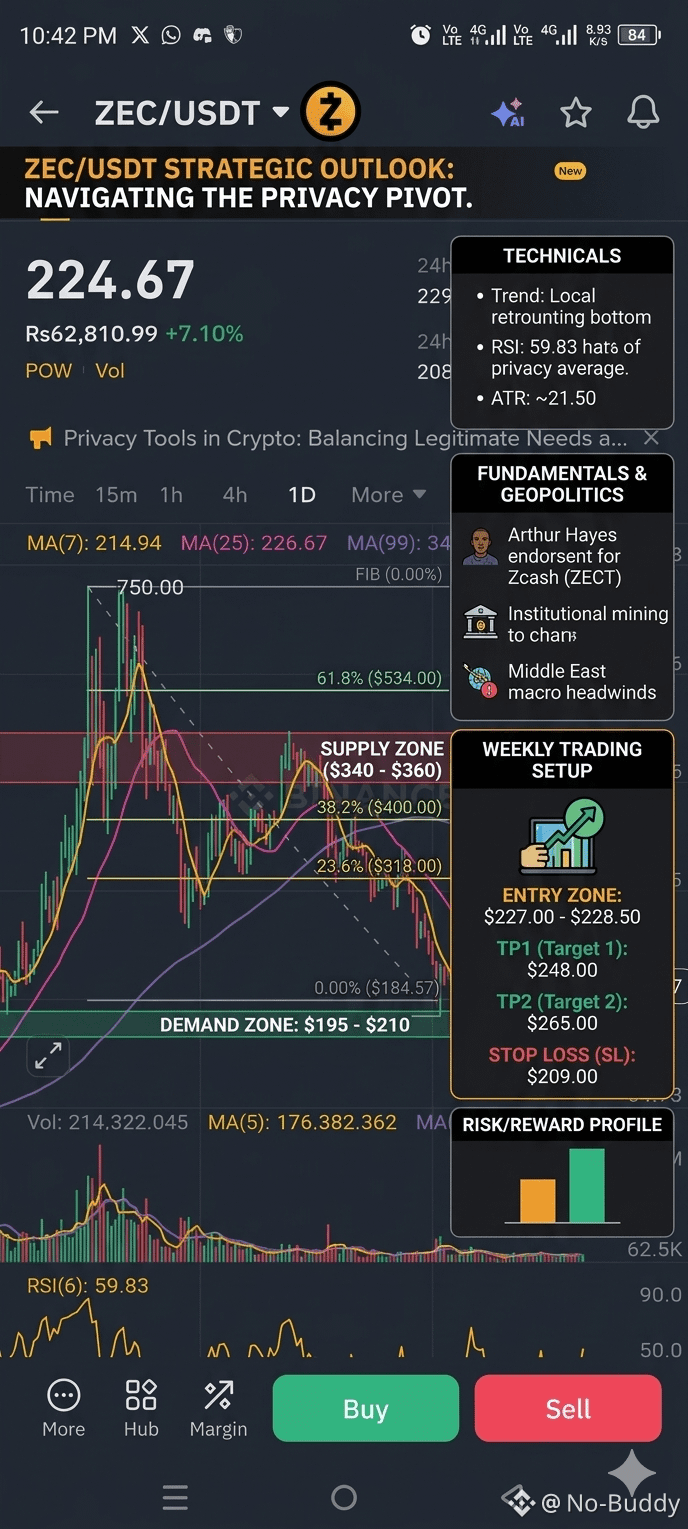
The provided chart for ZEC/USDT on the daily (1D) timeframe shows a classic "rounding bottom" attempt after a period of intense volatility. With the price currently sitting at 224.67, we are at a critical juncture where technical structures meet shifting fundamental narratives for March 2026.
1. Technical Analysis: The Path of Least Resistance
* Trend & Moving Averages: The price is currently sandwiched. It is trading above the MA(7) (214.94) but remains pinned under the MA(25) (226.67) and the heavy MA(99) (344.15). This suggests a short-term bullish recovery within a medium-term bearish trend.
* RSI(6): At 59.83, the Relative Strength Index is trending upward but has not yet reached the overbought territory (70+). This indicates there is still "fuel in the tank" for a push toward the $240-$250 resistance zone.
* Support & Resistance: * Resistance: The immediate ceiling is $228-$235. A breakout here targets the psychological $250 mark.
* Support: The strongest floor is the recent swing low at $184.57, with a minor "demand zone" established around $200-$210.
* ATR (Average True Range): Based on the current volatility visible in the candle wicks (highs of 229.99 and lows of 208.43 in 24h), the daily ATR is approximately $21.50. Traders should expect daily swings of this magnitude.
2. Fundamental & Geopolitical Analysis
* The Privacy Narrative (Bullish): In early 2026, Zcash is regaining traction. Influential backing (like recent endorsements from Arthur Hayes) and Foundry Digital’s launch of institutional mining pools have shifted the "dead coin" sentiment.
* Macro Headwinds (Bearish): Geopolitical tensions in the Middle East and the Strait of Hormuz are currently driving investors toward "hard" safe havens like Gold and Oil. High Federal Reserve interest rates (holding steady through March 2026) continue to pressure high-risk assets like ZEC.
* Supply Dynamics: With roughly 75% of the total 21 million supply already in circulation, ZEC is entering a "scarcity phase." Lowered issuance post-halving means any spike in demand (due to privacy concerns or ETF rumors) could lead to rapid price appreciation.
3. Fibonacci Retracement Levels
Drawing from the local high (~$750) to the local low (~$184):
* 23.6% Level: ~$318 (Key mid-term target)
* 38.2% Level: ~$400 (Major trend reversal confirmation)
* Immediate Focus: The price is currently struggling to even reclaim the 0% "bottom" range effectively; a close above $250 is the first step toward the Fibonacci levels.
4. Recommended Trading Setup (Next 7 Days)
> Strategy: "The Breakout Scalp"
> Since the price is hovering near the MA(25) resistance, the play is to wait for a confirmed daily close above the immediate hurdle.
>
| Feature | Value |
|---|---|
| Entry Zone | $227.00 - $228.50 (After 4H candle close above MA25) |
| Take Profit 1 (TP1) | $248.00 (Psychological Resistance) |
| Take Profit 2 (TP2) | $265.00 (Supply Zone) |
| Stop Loss (SL) | $209.00 (Below recent daily low/MA7) |
| Risk/Reward | ~1:2.1 |
Summary Table: Demand & Supply Zones
| Zone Type | Price Range | Importance |
|---|---|---|
| Major Supply | $340 - $360 | Confluence with MA(99); heavy selling expected here. |
| Minor Supply | $245 - $255 | Recent rejection area; profit-taking zone. |
| Demand Zone | $195 - $210 | Strong buying interest; where whales are accumulating. |
| Macro Support | $180 - $185 | The "Line in the Sand"; if this breaks, trend turns ultra-bearish. |
#Zcash #ZECUSDT #PrivacyCoins #TechnicalAnalysis
TRADE NOW
