
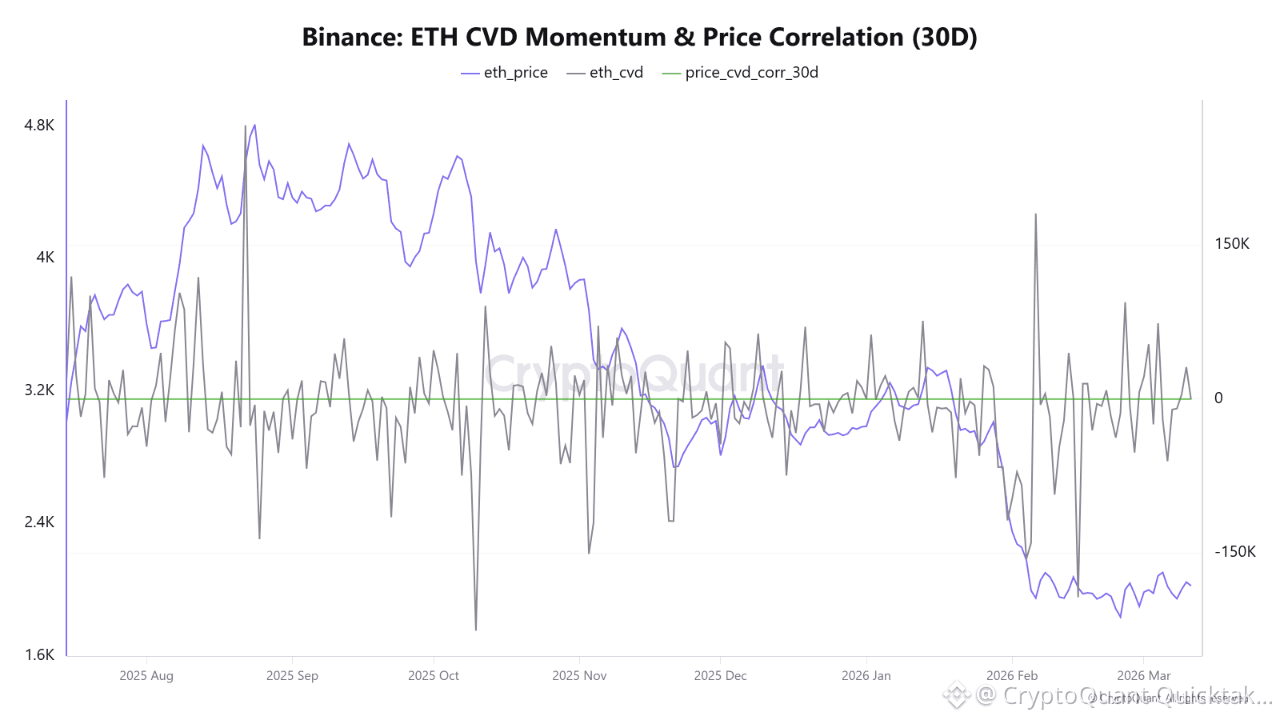
The CVD (Cumulative Volume Delta) indicator on Binance shows the relationship between buy and sell order flows in the Ethereum market, as well as the extent to which these flows correlate with price movements. This indicator measures the cumulative difference between buy and sell order volumes, helping determine whether buyers or sellers are dominating the market over a specific period.
According to the data, Ethereum is currently trading around $2,000, while the CVD value stands at approximately 31,207 contracts, indicating a slight bias toward buy orders compared to sell orders at that moment. However, the indicator has shown sharp fluctuations between positive and negative values over the past few months, suggesting a clear struggle between buyers and sellers in the market, especially during periods of price volatility.
In addition, the 30-day price-CVD correlation indicator shows a value of approximately 0.682, a positive reading that indicates a moderate to strong correlation between price movements and trading order flows. When this value is positive and relatively high, it suggests that price movements genuinely reflect the activity of buyers and sellers in the market, rather than movements driven by low liquidity or external factors.
It is also noteworthy that the periods of sharp price declines at the beginning of 2026 coincided with a clear decrease in CVD momentum, indicating increased selling pressure compared to buying pressure. However, the indicator’s recent shift toward positive values may reflect the beginning of a gradual improvement in demand or an attempt by buyers to regain control of the market.
Written by Arab Chain