$LTC Litecoin (LTC) is one of the oldest cryptocurrencies, often called the “silver to Bitcoin’s gold.” It is widely used for fast transactions and active trading due to its high liquidity and volatility.
📉 Current Market Overview
Market Type: Crypto (Altcoin)
Trend: Bearish to neutral (short-term consolidation)
Volatility: Medium–High (good for day traders & scalpers)
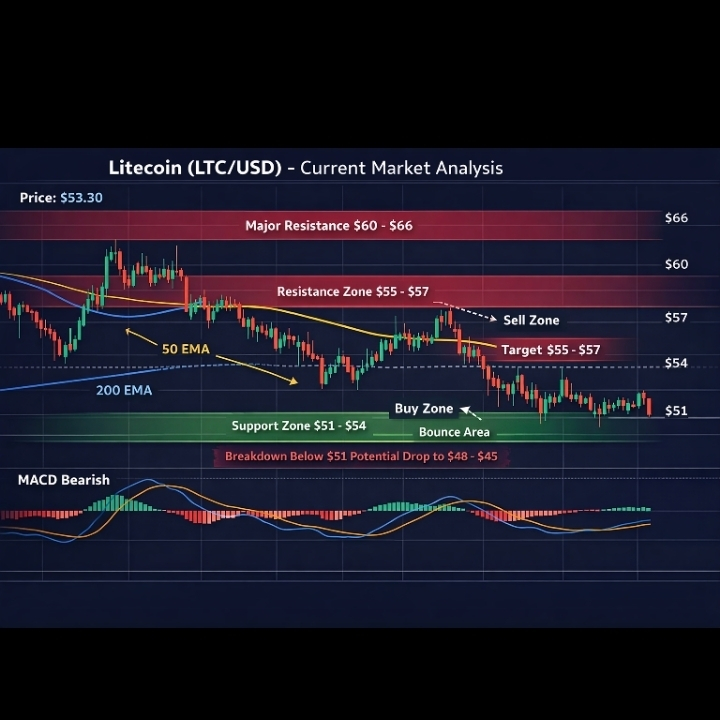
LTC is currently trading inside a range, meaning buyers and sellers are in balance. No strong breakout has happened yet.
🔢 Key Price Levels (Important Numbers)
Support Zones (Buy Interest)
$51 – $54 → Strong buying area
If price breaks below $51, selling pressure may increase
Resistance Zones (Sell Pressure)
$55 – $57 → Immediate resistance
$60 – $66 → Major resistance (trend change zone)
📈 Technical Indicators Summary
RSI (Relative Strength Index)
Near oversold zone
Suggests: Possible short-term bounce, but trend still weak
Moving Averages (EMA 50 / EMA 200)
Price below major EMAs
Indicates sellers still control the higher timeframe
Volume
Low to moderate volume
Breakout needs strong volume confirmation
🧠 Simple Trading Strategies (Educational)
🔹 Strategy 1: Range Trading (Beginner Friendly)
Buy: Near $51–$54
Sell: Near $55–$57
Stop-Loss: Below $50
✔ Works well while price stays in range
🔹 Strategy 2: Breakout Trade
Entry: Daily candle close above $57
Target: $60 → $66
Stop-Loss: Around $55
✔ Best when volume increases
🔹 Strategy 3: Bearish Scenario (Advanced)
If price breaks below $51
Target: $48 → $45
Stop-loss above $54
⚠ Only for experienced traders
🕯️ Candlestick Behavior to Watch
Bullish signs: Hammer, bullish engulfing near support
Bearish signs: Long red candles, rejection wicks near resistance
🔗 Market Correlation
Litecoin often follows Bitcoin’s direction.
If Bitcoin goes up → LTC usually follows
If Bitcoin drops → LTC may fall harder
⚠️ Risk Disclaimer
This article is for education only, not financial advice.
Crypto markets are volatile — always use stop-loss and proper risk management.
👉 Next step?
Reply “Images” and I’ll generate candlestick chart images showing:
Support & resistance
Buy/sell zones
Trend direction