
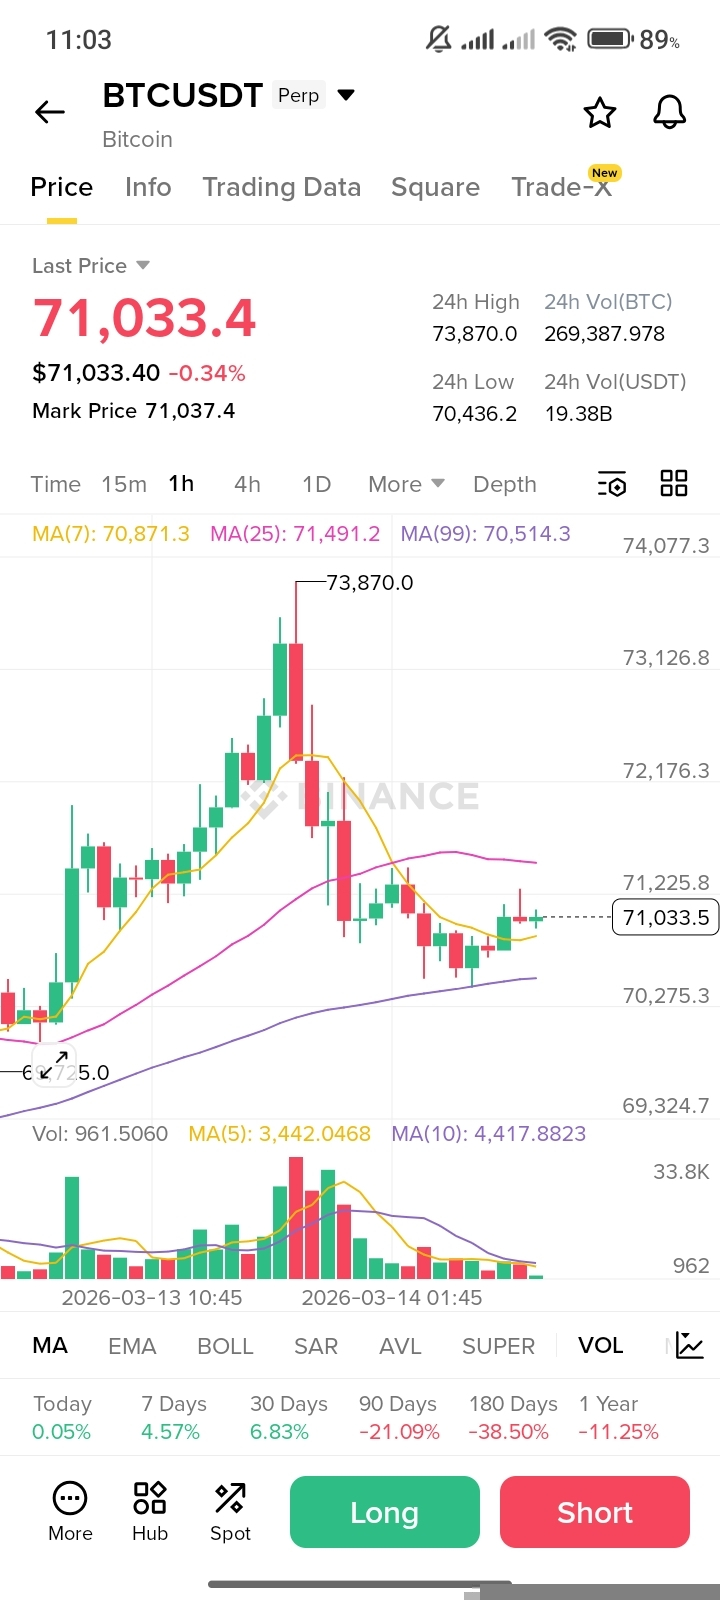
Bitcoin has cooled off after a sharp rejection at the $73,870 local high. The 1-hour chart shows a classic "relief" structure where the initial aggressive sell-off has slowed, giving way to a period of consolidation.
🔍 Technical Breakdown
* Resistance at the Top: The wick reaching toward $74k was met with significant selling pressure, resulting in a series of red candles that sliced through the MA(7) and MA(25).
* Moving Average Convergence: We are currently seeing the price trade tightly between the MA(99) at $70,514 (acting as immediate support) and the MA(25) at $71,491 (acting as overhead resistance).
* Volume Profile: Selling volume has peaked and is now beginning to taper off. This suggests that the "panic" phase is over, and the market is looking for a new floor.
📈 The Bullish Scenario
If BTC can flip the $71,500 zone back into support, we could see a retest of the $72,200 level. Bulls need to maintain the higher low established near $70,400 to keep the medium-term uptrend intact.
📉 The Bearish Scenario
A break below the MA(99) ($70,514) would likely trigger a deeper correction toward the $69,300 psychological support. Keep a close eye on the 4-hour close; a failure to hold $70k could shift the momentum back to the bears.
💎 GEM ALERT: $BTC / USDT
The chart is carving out a consolidation base after the recent volatility. Stability here could lead to a fresh leg up.
* Signal Type: LONG 🟢
* Mode: Isolated
* Leverage: 20x (Adjust to risk)
* 👉 Entry Zone: 70,800 - 71,100
* 🎯 Take Profit Targets: 1. 72,000 (25% profit)
2. 73,100 (Mid-term)
3. 74,500 (Moon bag 🚀)
* 🛑 Stop Loss: 70,200 (Strict)
This is a high-risk scalp. Secure profits early! Disclaimer: Not financial advice. Always DYOR before entering any trade.


