Ethereum $ETH is currently screaming for attention at $1,992. After a brutal start to 2026, the charts show a classic "coiling" effect. We are trapped in a high-stakes battle between a Bear Pennant (targeting $1,100) and a potential W-Bottom Reversal (targeting $2,650).
🔍 Technical Breakdown
The Bear Case: ETH is trading below its Realized Price, meaning the average holder is currently "underwater." With $887M in ETH flowing into exchanges recently, sell pressure is peaking. If we lose the $1,800 "Line in the Sand," expect a fast slide toward the $1,300 demand zone.
The Bull Case: If buyers defend the $1,800–$1,900 support zone, we could see a massive "short squeeze." A breakout above $2,100 would flip the script, opening the door to fill the Fair Value Gap (FVG) up to $2,600.
📊 Key Levels to Watch
Level Significance Action
$2,100 Major Resistance Bullish Confirmation
$1,800 Critical Support Last Line of Defense
$1,100 Bear Target Capitulation Bottom
⚡ Trading Signal: ETH/USDT (Swing Setup)
Direction: 🟢 LONG (Conditional Breakout)
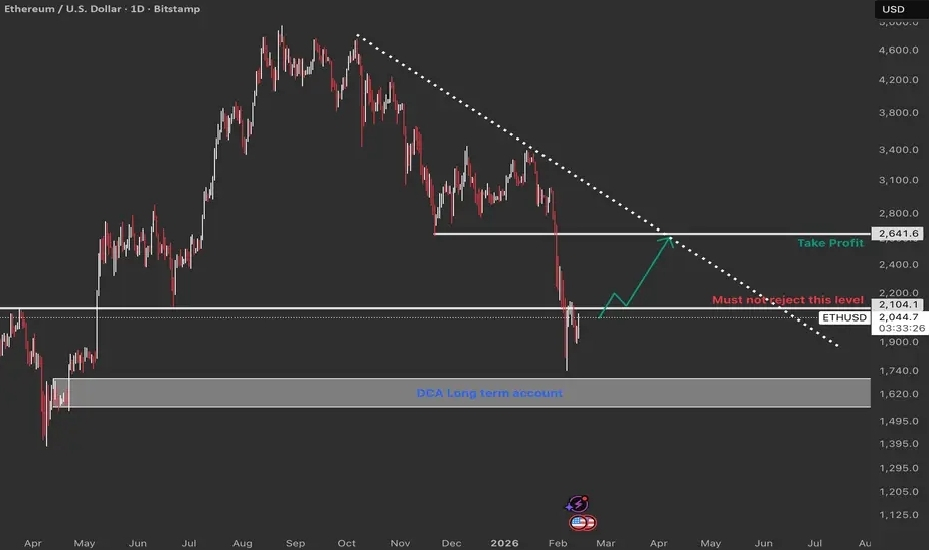
Entry Zone: Enter ONLY on a daily candle close above $2,030 (or DCA in the $1,750–$1,850 value zone for long-term).
Target 1: $2,150 (Quick Scalp)
Target 2: $2,400 (Mid-term)
Target 3: $2,650 (Major Resistance)
Stop Loss: $1,780 (Below critical structural support)
⚠️ Risk Note: Market sentiment is currently heavy. Do not FOMO. If $1,800 breaks, cancel long bias and wait for the $1,300 accumulation zone.
