*Bitcoin (BTC/USDT) Market Analysis – March 15, 2026*
The screenshot shows the BTC/USDT trading pair priced at *71,532.40 USDT*, with a 24‑hour increase of *1.17%*. The local currency value is displayed as *Rs 19,998,313.06*. Here’s a concise breakdown of the key data and what it implies for traders: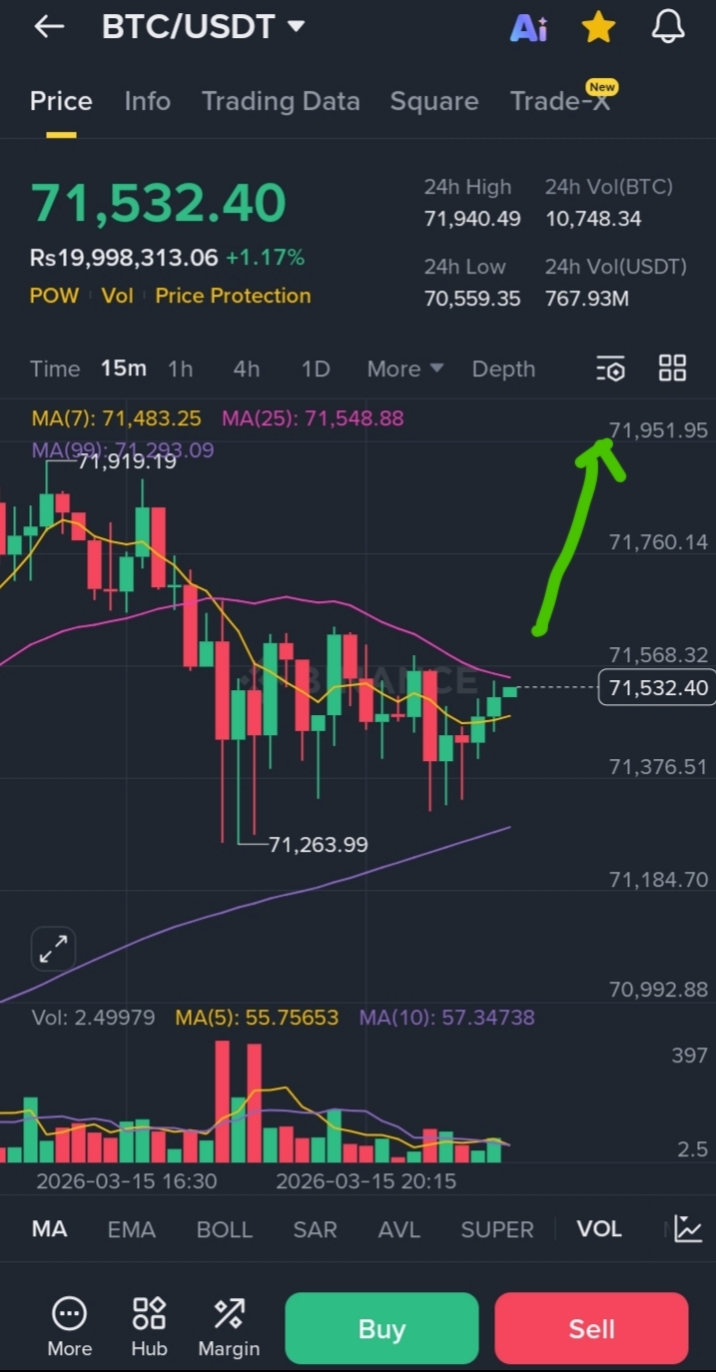
1. *Price Movement*:
- Current price: 71,532.40 USDT.
- 24 h high: 71,940.49 USDT; 24 h low: 70,559.35 USDT.
- The price is consolidating near the high, indicating bullish momentum.
2. *Volume*:
- 24 h volume (BTC): 10,748.34 BTC.
- 24 h volume (USDT): 767.93 million.
- Healthy volume supports the price rise, suggesting strong market interest.
3. *Technical Indicators (MA – Moving Averages)*:
- MA(7): 71,483.25 – short‑term support.
- MA(25): 71,548.88 – medium‑term trend guide.
- MA(99): 71,919.19 – long‑term resistance.
- The price is above the 7‑ and 25‑period MAs, signaling an uptrend.
4. *Chart Patterns*:
- The candlestick chart shows mixed green and red bars with wicks, indicating price volatility within the session.
- Bollinger Bands (BOLL) are visible, suggesting the price is near the upper band, which may hint at potential overbought conditions.
5. *Trading Action*:
- “Buy” and “Sell” buttons indicate the platform’s trading options.
- Traders may watch the 71,500 level for support and the 72,000 zone for resistance.$BTC


#