ETH/USDT – Daily Analysis for Traders (1D Chart) 📊$
Pair: ETH/USDT
Timeframe: 1 Day (1D)
Market Trend: Bullish Momentum 📈
Market Overview:
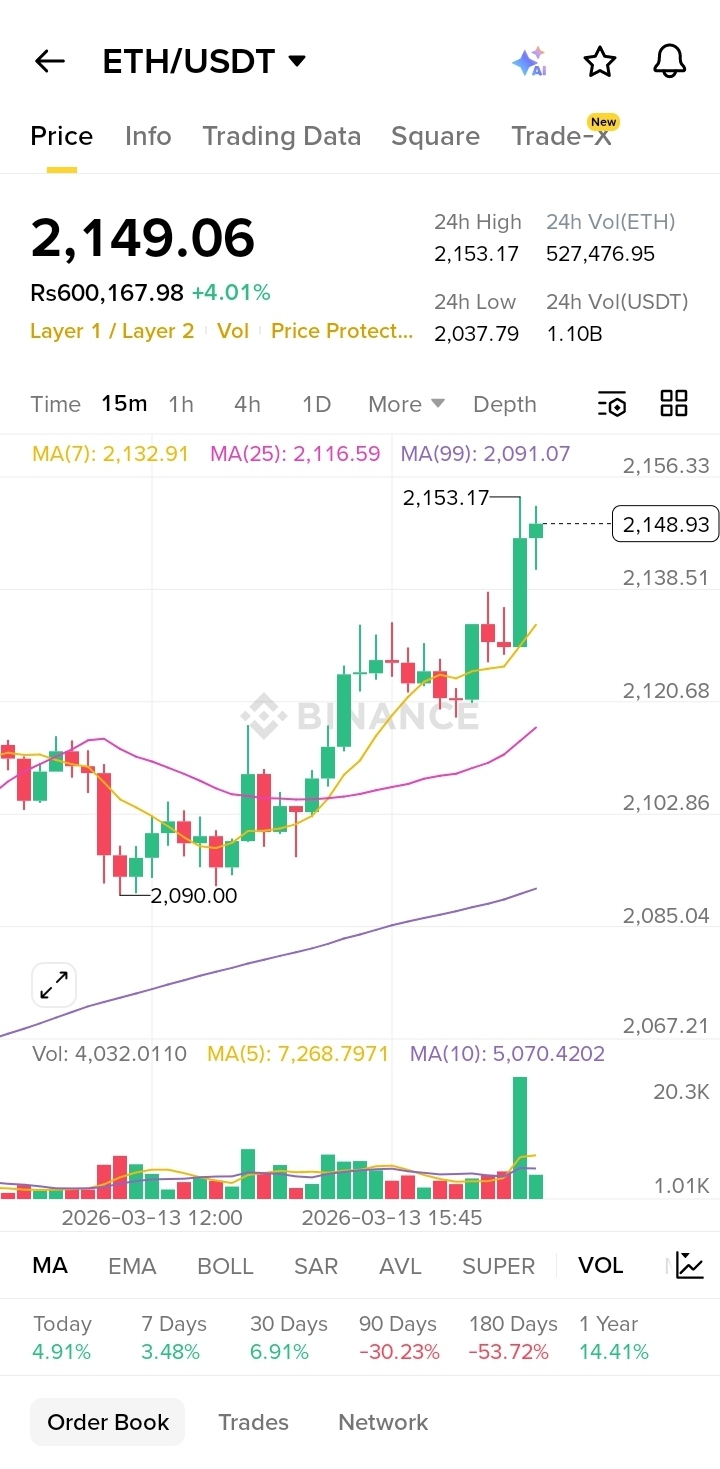
Ethereum is showing steady bullish momentum on the daily timeframe. The price structure indicates higher lows, suggesting buyers are gradually gaining control. If ETH maintains its position above key support levels, the upward movement could continue.
Key Support Levels:
3,400 USDT
3,250 USDT
Key Resistance Levels:
3,600 USDT
3,800 USDT
Technical Indicators:
Moving Averages: Price is trading near and slightly above short-term moving averages, supporting the bullish outlook.
Volume: Stable trading volume indicates consistent participation from traders.
Momentum: A breakout above 3,600 USDT could open the path toward 3,800 USDT.
Trading Setup (Educational):
Buy Zone: 3,420 – 3,480 USDT
Target 1: 3,600 USDT
Target 2: 3,800 USDT
Stop Loss: 3,250 USDT
⚠️ Disclaimer: This analysis is for educational purposes only. Always manage risk and do your own research before trading.#ETH