
 I've been watching Bitcoin's setup closely, and what's unfolding right now is one of the more calculated positioning phases I've seen in recent months.
Open Interest has climbed back toward 88,000 BTC following the recent flush, according to Coinglass data. That kind of leverage rebuild after a deleveraging event typically means one thing traders are reloading for the next major move, not retreating from it. Whether that move goes up or down is exactly the uncertainty smart money is betting on.
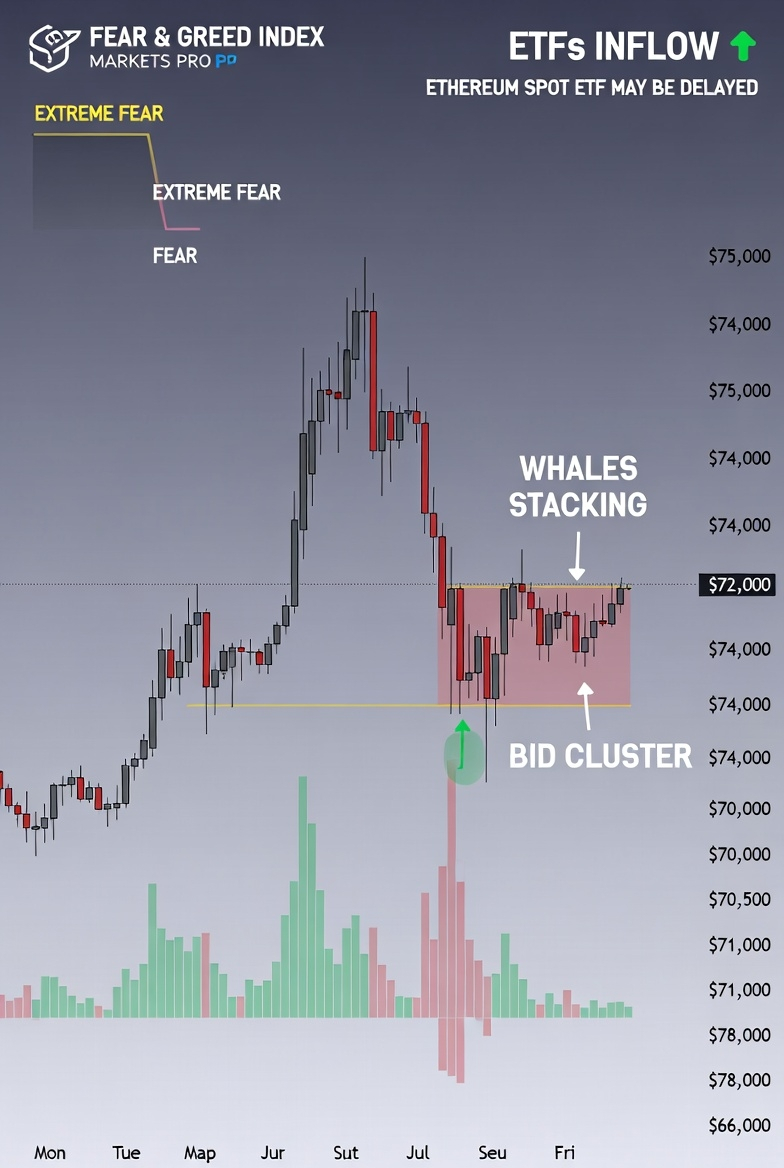
The whale picture adds important context. Large sell walls are stacked between $72K and $74K, which represents real overhead resistance. But on the downside, bid clusters are forming around $70,500 to $71K with a deeper support band near $69K to $70K. This layered positioning on both sides is not random. It reflects deliberate placement ahead of what could be a high-volatility event near $75K.
What separates the current rally from prior corrections is the broader data backing it. Bitcoin's weekly performance represents its strongest bullish stretch since before the October crash that triggered a 30-plus percent pullback from the $126K high. Meanwhile, the Crypto Fear and Greed Index has moved from 16 to 32, signaling that extreme fear is beginning to ease across the market.
The institutional picture is also shifting. Bitcoin ETF inflows have outpaced gold ETF flows since the latest macro uncertainty escalated, with IBIT assets rising roughly 1.5% while GLD declined around 2.7%, per CoinMarketCap figures cited by JPMorgan. Investors rotating toward BTC during macro stress is not a small signal.
Taken together, the setup points to an increasingly likely breakout. If sell walls at $72K to $74K get absorbed and short pressure builds, a squeeze could become the mechanism that pushes BTC through $75K. Smart money rarely stacks positions this way without expecting a catalyst. The question is no longer whether volatility is coming
it is when.#cryoto #Market_Update #Iran'sNewSupremeLeader #PCEMarketWatch