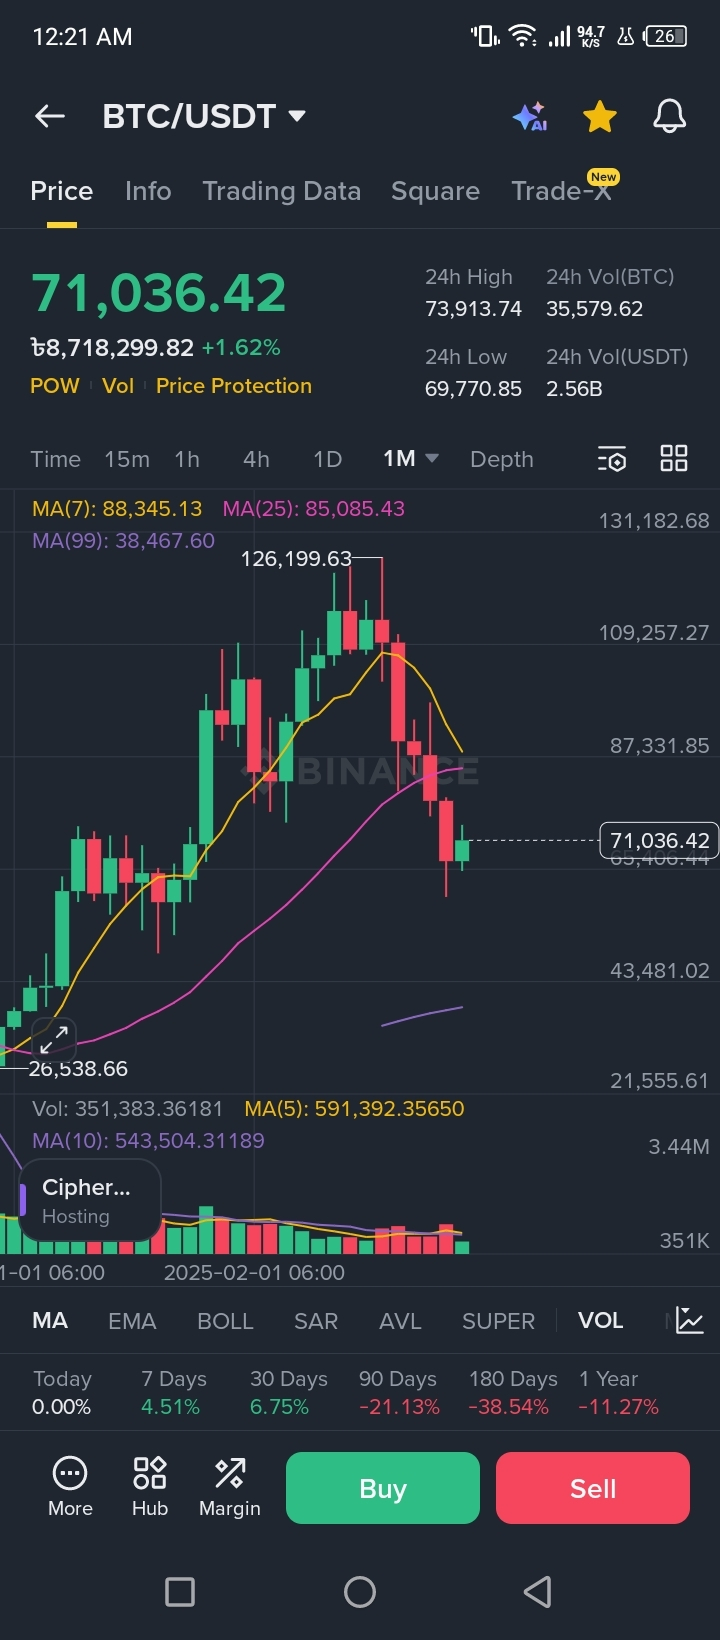
Looking at the current BTC/USDT 1-month chart, things are getting very interesting. After reaching a peak of around $126k, we saw a natural market correction. But look closely at the current price of $71,036! 📉➡️📈
Key Observations from the Chart:
1. Support Level: Bitcoin is showing strong resilience around the $65k - $70k zone. This consolidation is a healthy sign for the next big move.
2. Moving Averages: The price is maintaining a position that suggests bulls are still in control for the long term.
3. Market Sentiment: Even with minor fluctuations, the overall trend remains bullish as we see higher lows being formed over the months.
My Strategy for This Market:
In this phase, 'Patience' is the biggest tool. Avoid panic selling during small dips. Instead, look for solid entries in fundamentally strong coins like $LTC or $BTC. Remember, the market rewards those who can wait through the volatility
Price Prediction:
If Bitcoin successfully holds the $70k support, we might see it testing the $80k resistance very soon. However, always keep an eye on the volume; a breakout with high volume will be the ultimate confirmation.
What do you think? Are we heading to $100k this year, or will there be another dip? I’d love to hear your thoughts in the comments below! 👇
🌟 Support the Analysis:
I spend a lot of time analyzing these charts to bring you the best insights. If you find this helpful, please Follow and Share this post!
And if you’d like to support my work, feel free to use the "Tip" button below. Your appreciation helps me continue providing quality analysis for our community! 💛💰
#BTC #bitcoin #CryptoAnalysis #Write2Earn #BinanceSquare #TradingStrategy #Bullish"$BTC