PEPE/USDT – Daily Analysis for Traders (1D Chart) 📊$
Pair: PEPE/USDT
Timeframe: 1 Day (1D)
Market Trend: Volatile with Bullish Potential 📈
Market Overview:
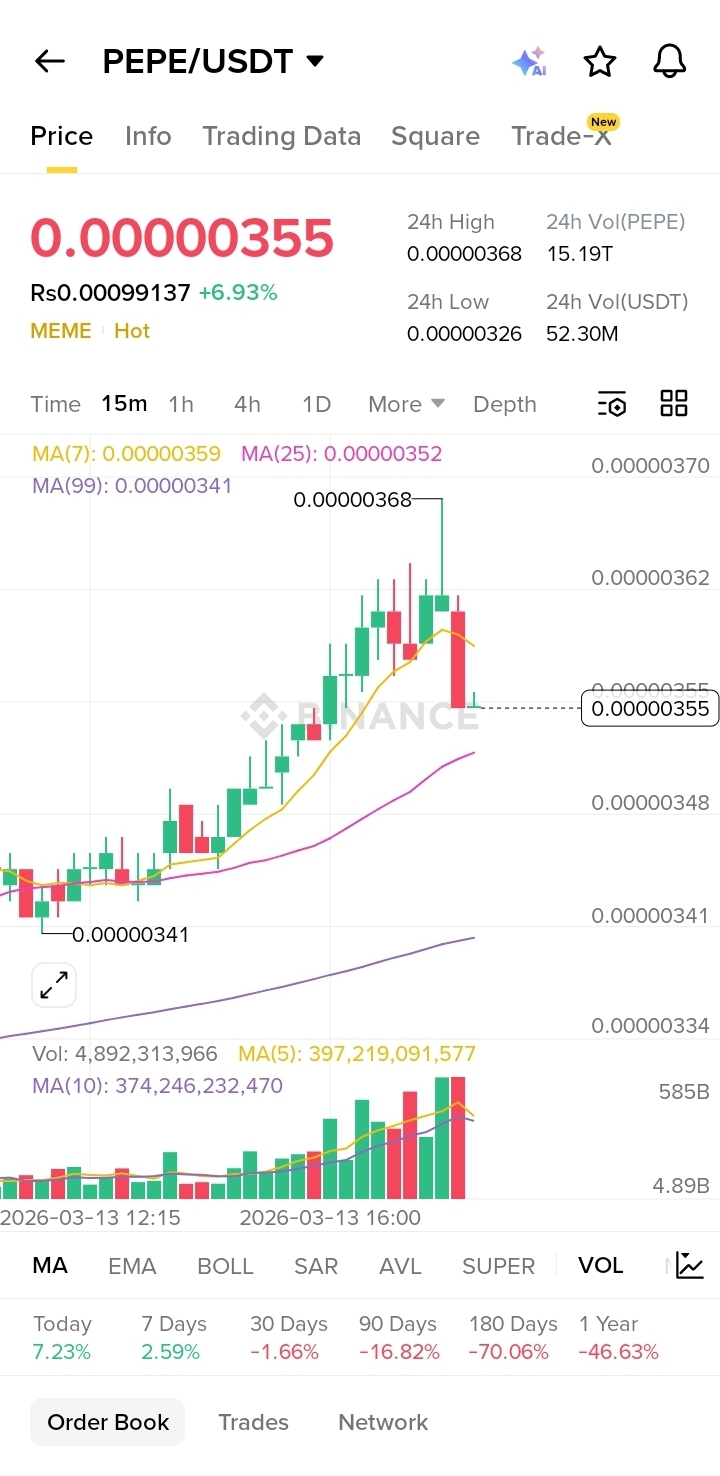
PEPE continues to attract strong interest from traders due to its high volatility and active trading volume. On the daily timeframe, the price shows signs of consolidation after recent momentum. If buyers maintain pressure, a breakout toward higher resistance levels may occur.
Key Support Levels:
0.00000650 USDT
0.00000600 USDT
Key Resistance Levels:
0.00000750 USDT
0.00000820 USDT
Technical Indicators:
Moving Averages: Price is fluctuating around short-term moving averages, indicating consolidation before the next move.
Volume: Healthy trading volume suggests strong market participation.
Momentum: A breakout above 0.00000750 could lead to further bullish movement.
Trading Setup (Educational):
Buy Zone: 0.00000660 – 0.00000690
Target 1: 0.00000750
Target 2: 0.00000820
Stop Loss: 0.00000600
⚠️ Disclaimer: This analysis is for educational purposes only. Always manage your risk and do your own research before trading.#PEPE