BNB Daily Analysis for Traders (1D Chart)
Pair: BNB/USDT
Timeframe: 1 Day (1D)
Market Trend: Bullish Momentum 📈
Technical Overview:
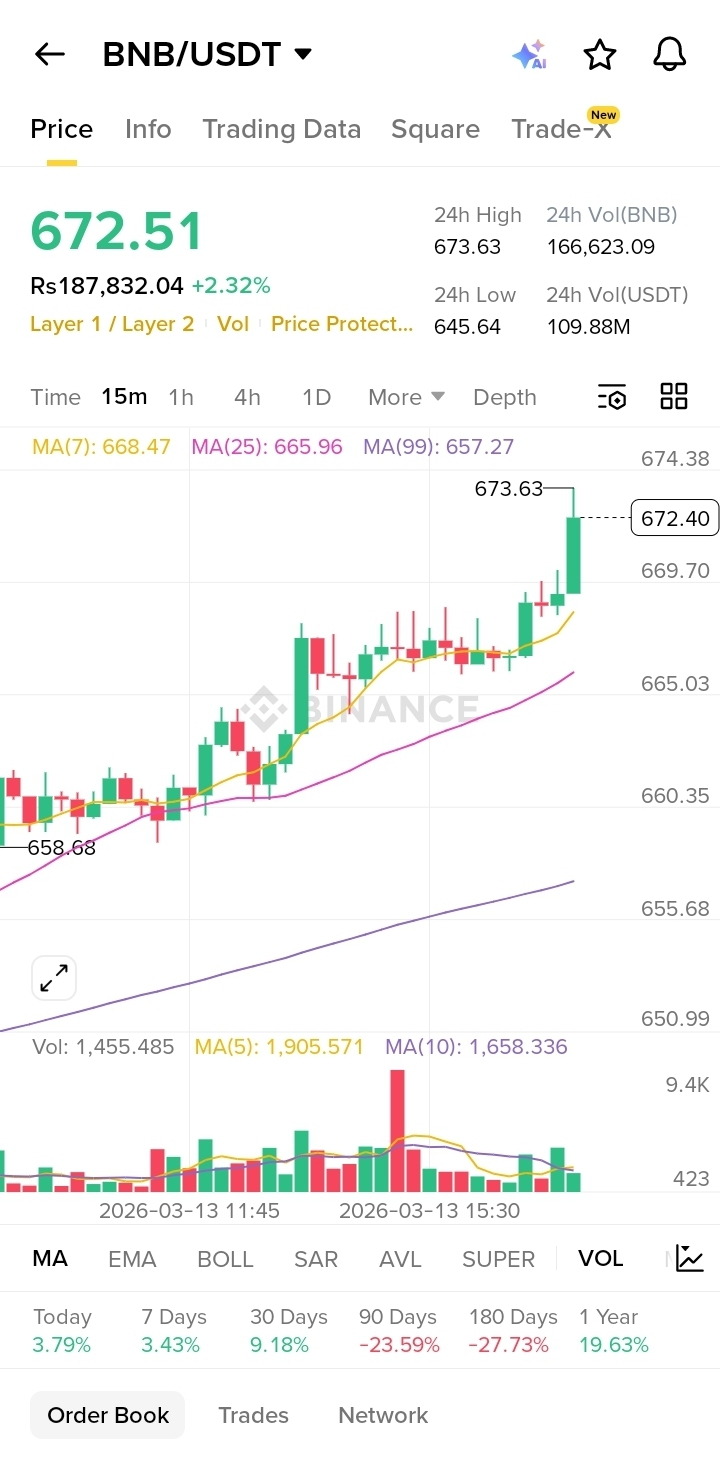
BNB is currently showing strong bullish momentum on the daily timeframe. The price has been moving above key moving averages, indicating sustained buying pressure. Buyers are controlling the market as higher highs and higher lows continue to form.
Key Support Levels:
660 USDT
640 USDT
Key Resistance Levels:
680 USDT
700 USDT
Indicators:
Moving Averages: Price is trading above the short-term and mid-term moving averages, supporting the bullish trend.
Volume: Increasing buying volume suggests strong market participation.
Momentum: If the price breaks the 680 resistance zone, the next possible target could be around 700 USDT.
Trading Idea:
Buy Zone: 660 – 670 USDT
Target 1: 680 USDT
Target 2: 700 USDT
Stop Loss: 640 USDT
Market Insight:
If BNB maintains support above 660, the bullish trend may continue. However, a break below 640 could lead to a short-term correction.
⚠️ This analysis is for educational purposes only. Always manage risk and do your own research before trading.#bnb一輩子