$ASTER / $USDT Daily Timeframe Technical Analysis
Market Structure
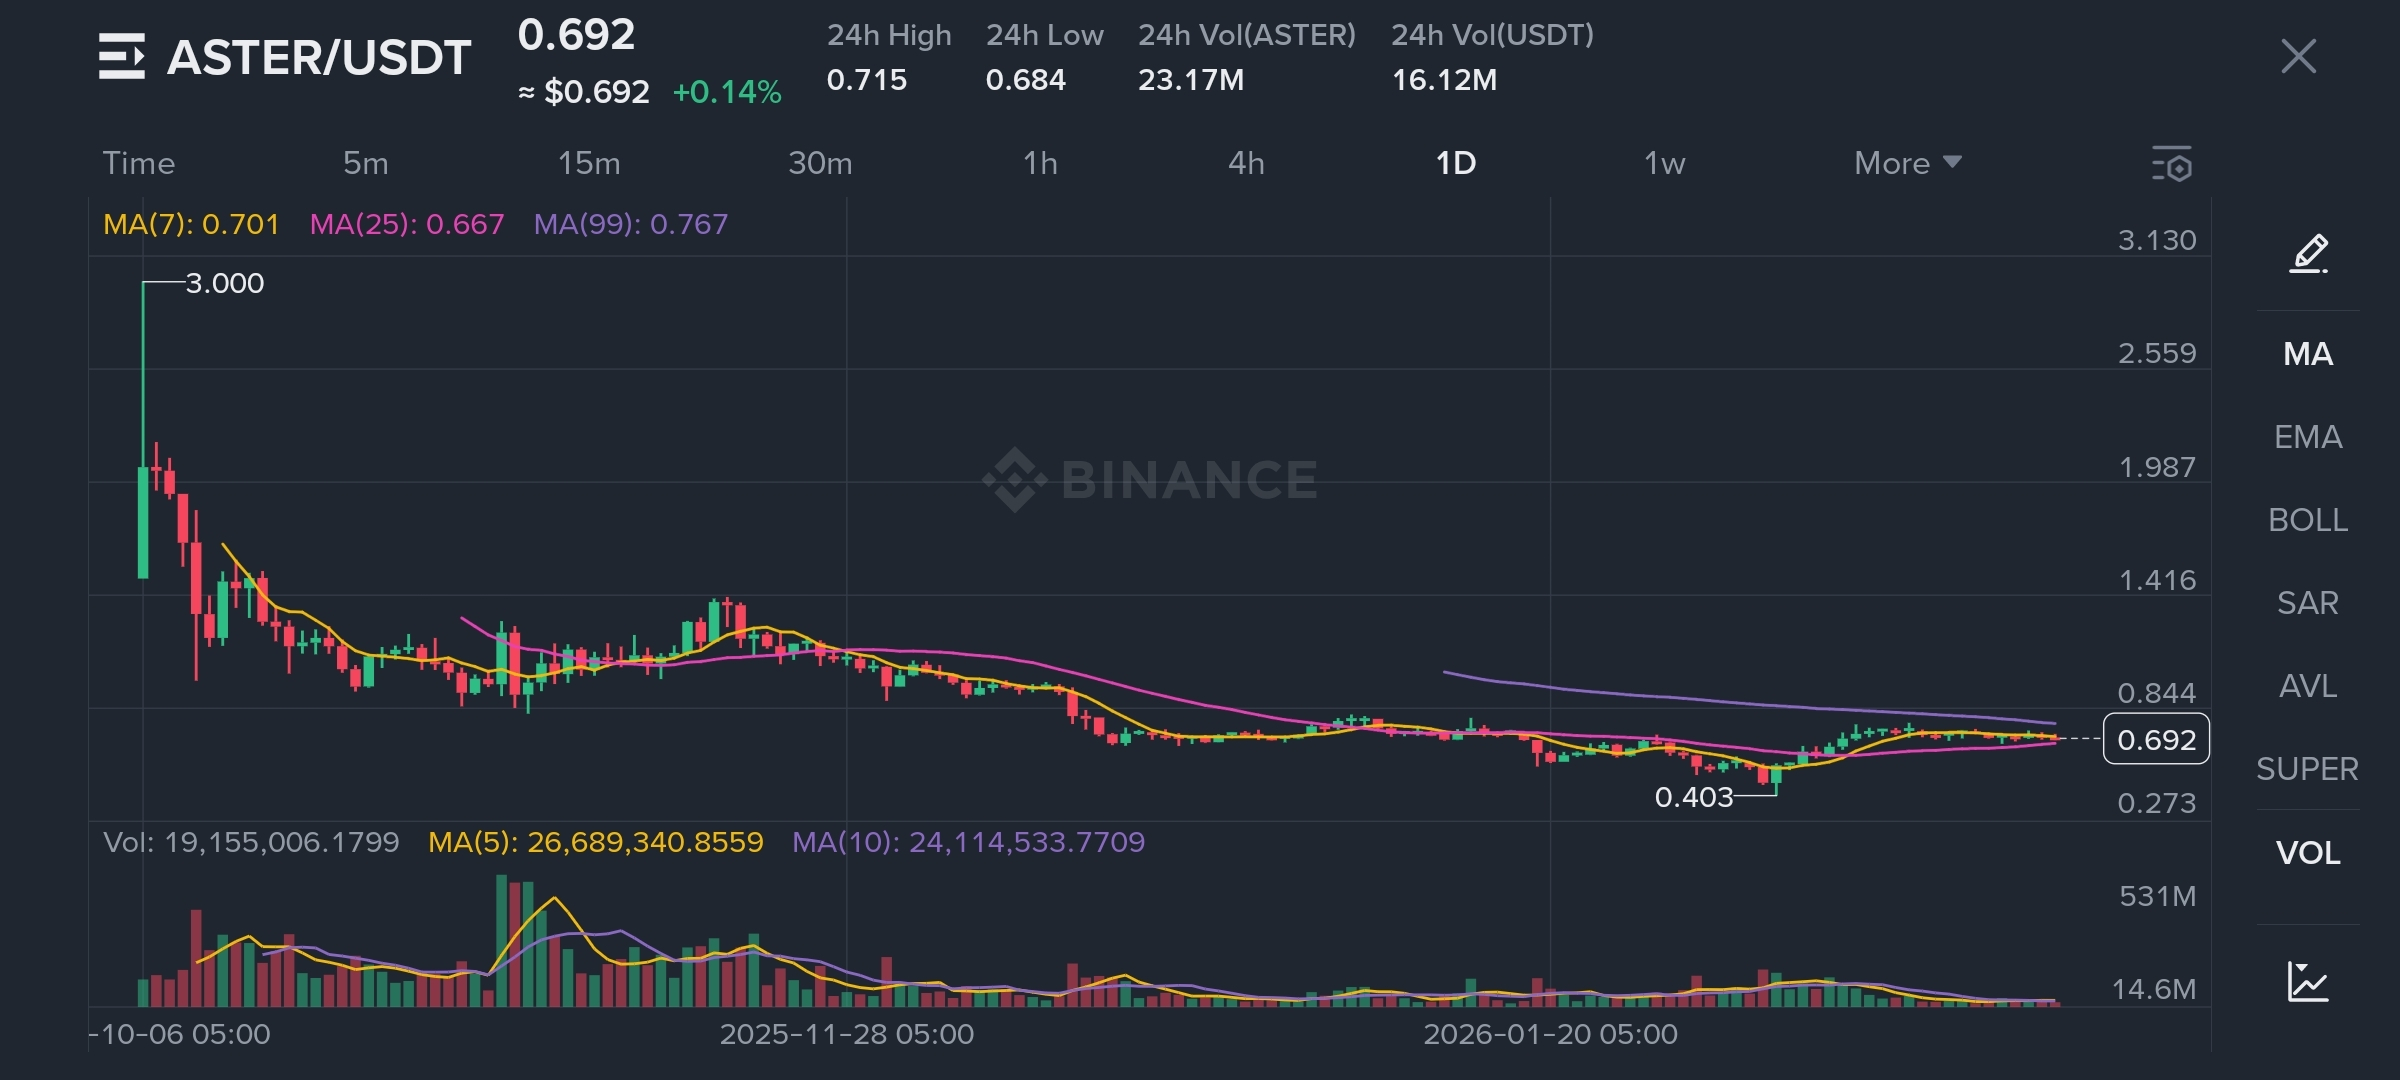
Initial spike near 3.00 followed by a prolonged downtrend
Series of lower highs and lower lows
Major bottom formed around 0.403
Current price trading near 0.69
Macro structure remains bearish but selling pressure has slowed
Moving Averages
MA7 around 0.701 and starting to curl upward
MA25 around 0.667 with price holding above it
MA99 around 0.767 and still sloping downward
Short-term momentum improving
Long-term trend still bearish while price remains below MA99
Support Levels
Strong structural support at 0.40 to 0.45
Mid-range support at 0.62 to 0.65
Loss of 0.62 increases probability of retesting 0.50 or 0.40
Resistance Levels
Immediate resistance between 0.75 and 0.80 near MA99
Next resistance around 0.84
Psychological resistance at 1.00
Daily close above 0.80 with strong volume would signal possible trend shift
Volume Analysis
Heavy volume during early selloff
Reduced volume during consolidation phase
Moderate increase in volume during bounce from 0.40
Strong breakout requires expansion in buying volume
Current Market Phase
Consolidation and possible accumulation
Volatility compression visible
Market preparing for a larger directional move
Break above 0.80 favors bullish continuation
Breakdown below 0.62 favors bearish retest
Technical Summary
Macro trend bearish
Short-term momentum recovering
Key breakout level 0.80
Key downside risk level 0.62
This is a neutral to cautiously bullish setup in the short term, but confirmation depends on a decisive move above resistance with volume support.