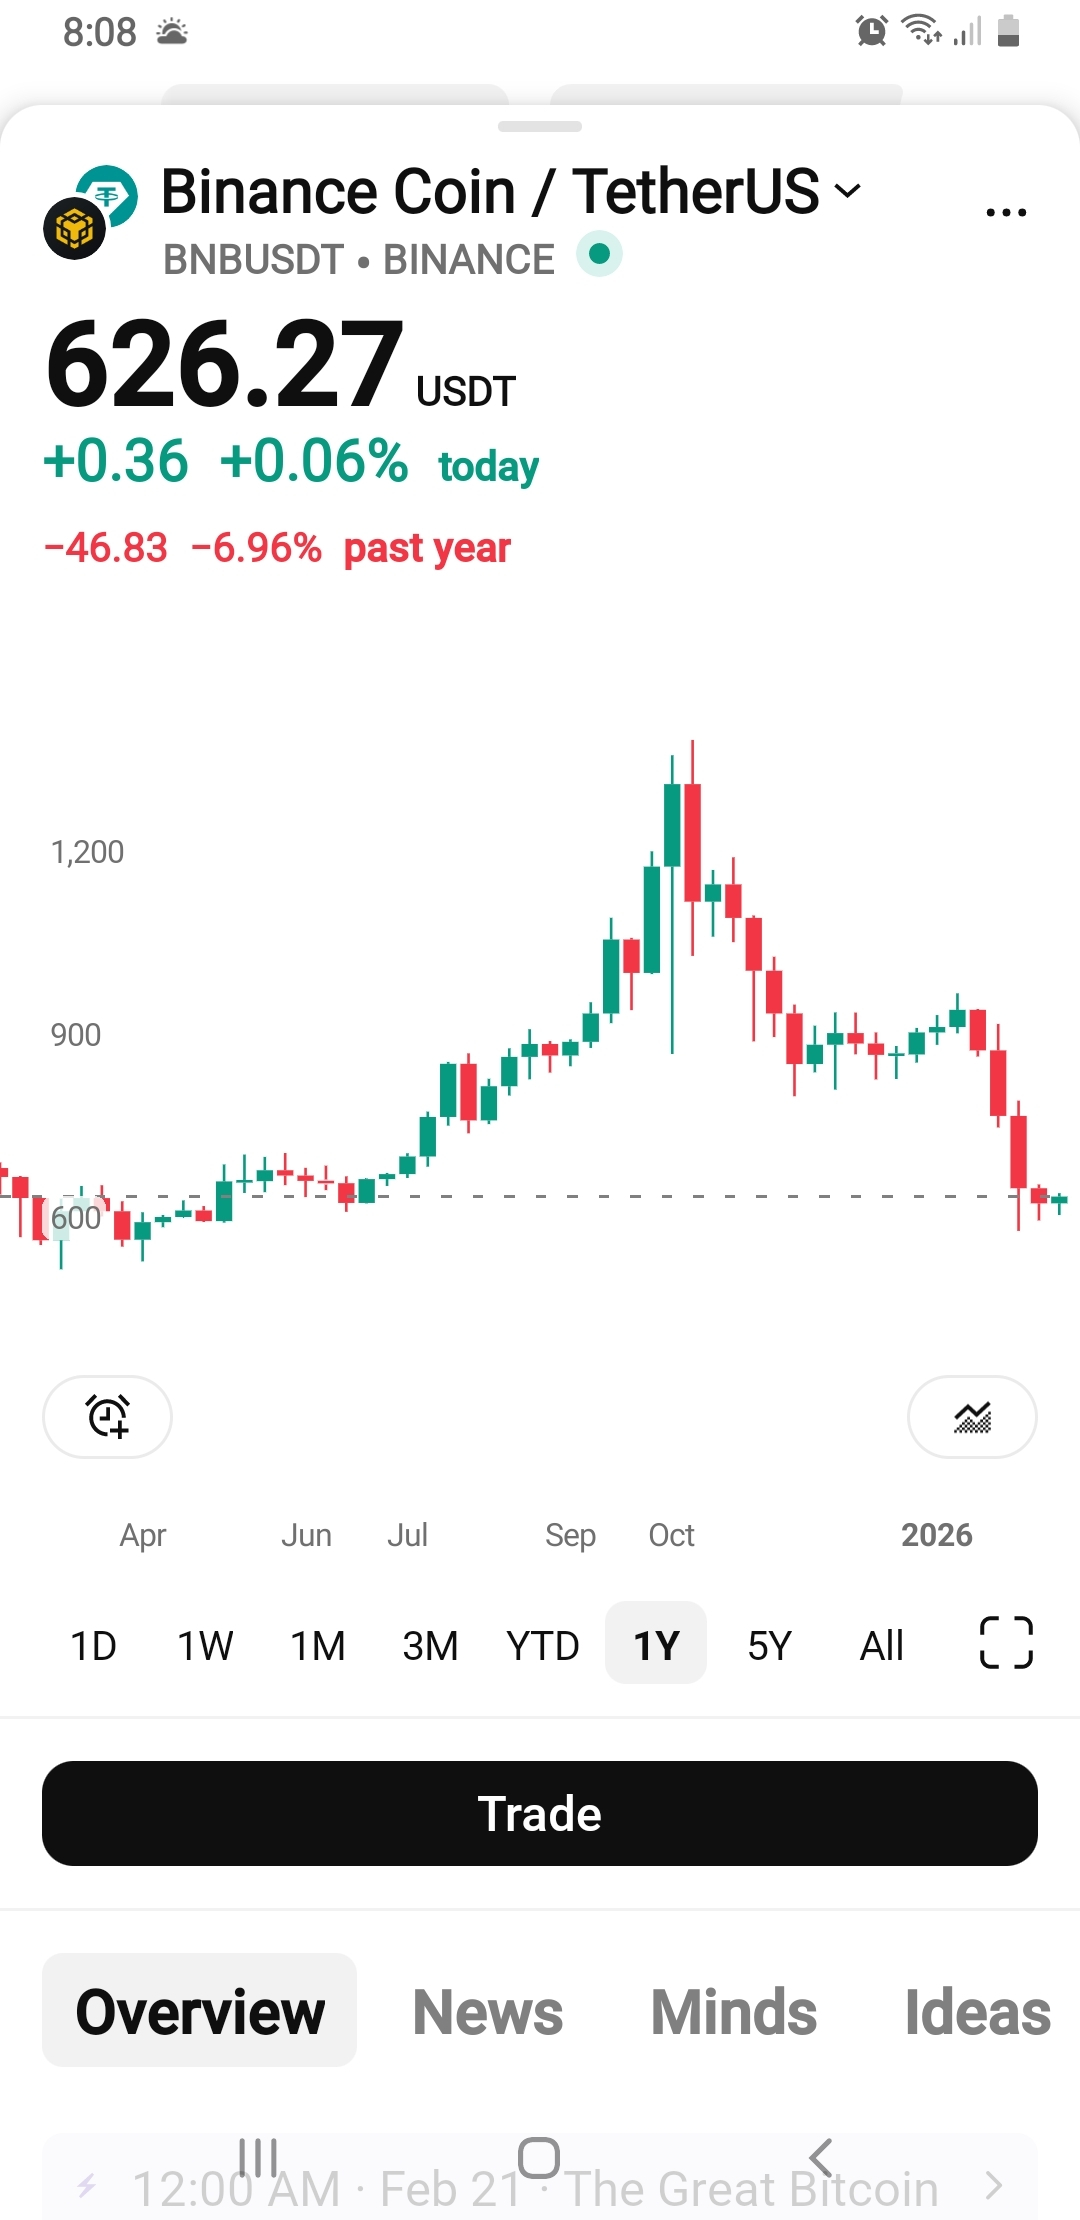
$BNB Looking at this 1-year chart of BNB/USDT.
BNB is currently trading around 626 USDT, and over the past year it shows an overall bearish structure. After a strong rally that pushed the price above the 1,200 USDT area, the market faced heavy selling pressure and formed a clear downtrend. Recently, the price has dropped sharply again and is now near a previous support zone around 600–650 USDT.
If this support level holds, we could see a short-term bounce or consolidation. However, if 600 USDT breaks with strong volume, the price may continue moving downward. Overall, the trend on the 1-year timeframe still looks weak unless BNB starts making higher highs and higher lows again.
This is just a personal market view, not financial advice.
Coin:$BNB