Understanding reversal patterns is crucial because they can indicate a change in the current trend, allowing you to capitalize on new opportunities. Here are some key patterns you should know:
1. Hammer
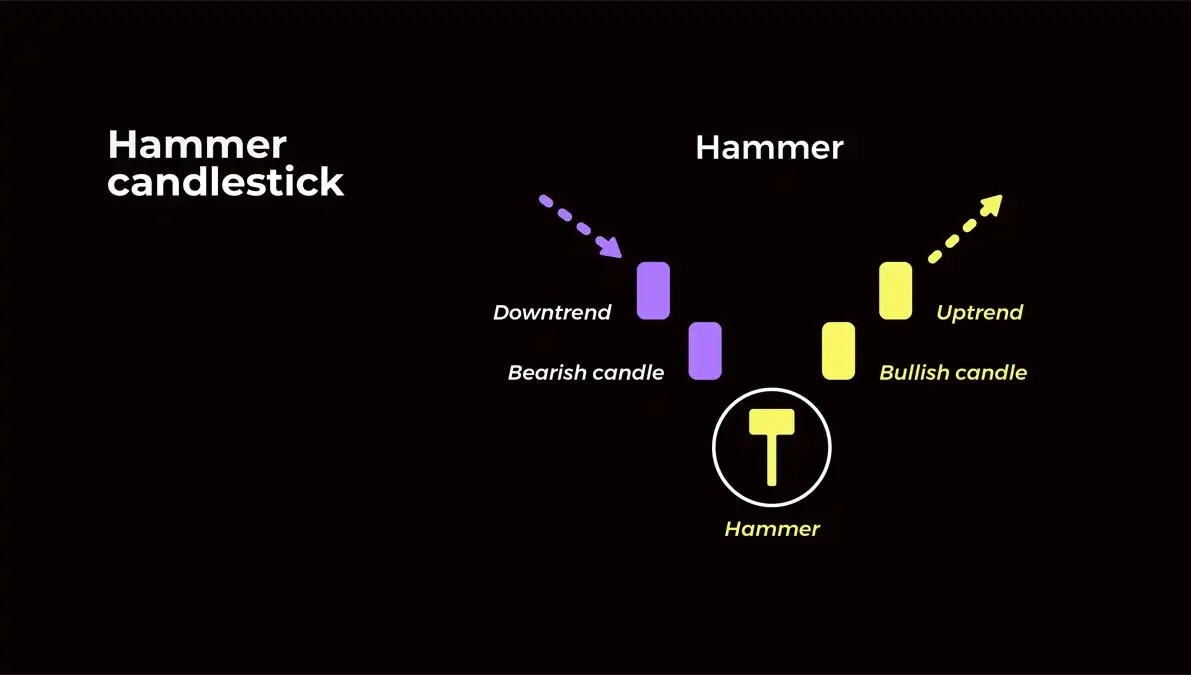
Picture this: The market is in a downtrend, and suddenly, you see a candlestick with a small body and a long lower wick—the hammer. This pattern suggests that while sellers pushed the price down, buyers stepped in, driving it back up. It’s a strong signal that a bullish reversal might be on the horizon, giving you a potential buying opportunity.
2 Inverted Hammer
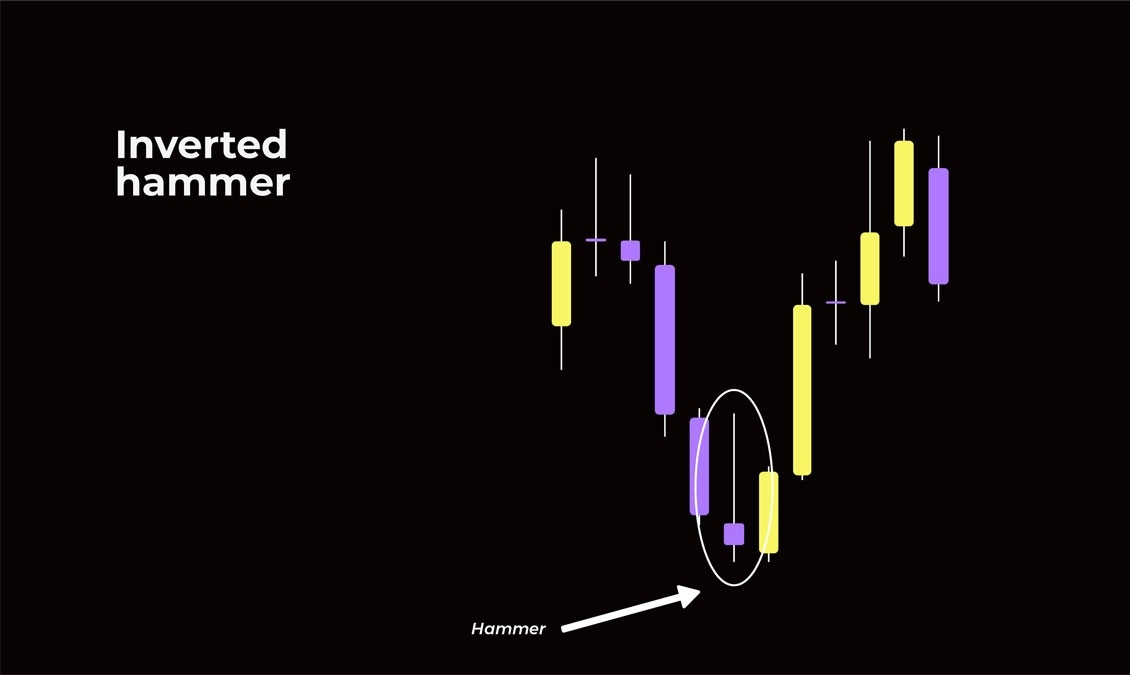
The inverted hammer appears at the end of a downtrend and looks like an upside-down hammer, with a small body at the bottom and a long upper wick. This pattern indicates that buyers tried to push the price higher during the session, but were unable to hold those gains. Despite this, it suggests that selling pressure may be weakening, hinting at a possible bullish reversal.
3 Bullish Engulfing Pattern
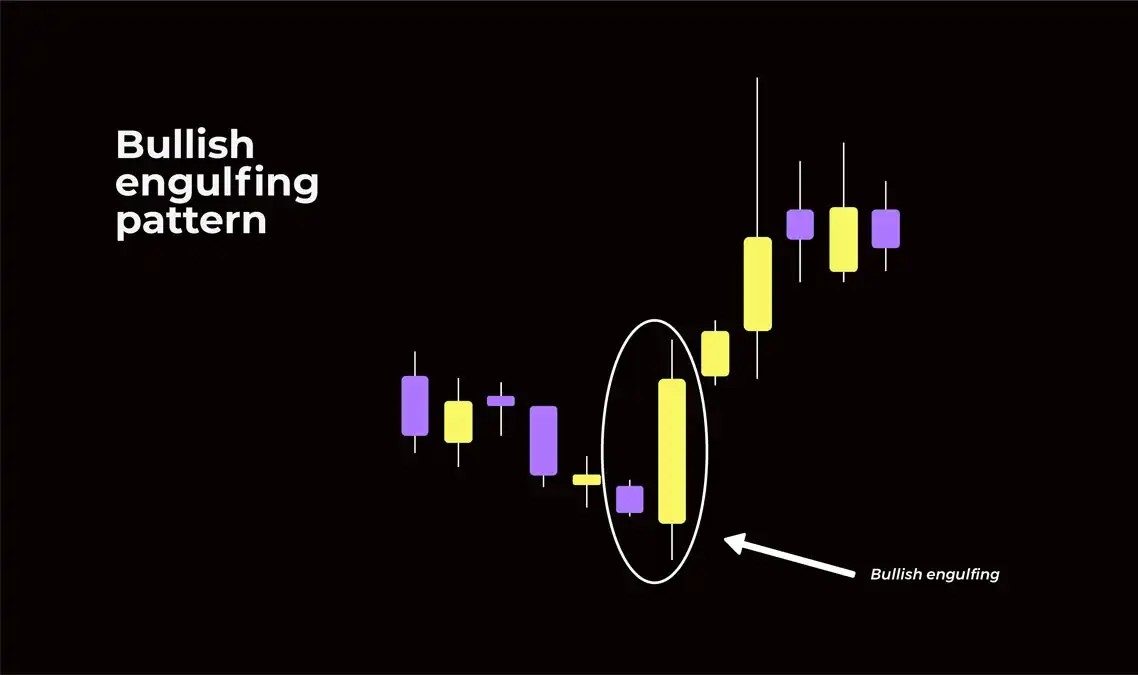
Imagine a small red candlestick followed by a large green one that completely engulfs it. This is the bullish engulfing pattern, signaling that buyers are taking control and a trend reversal is likely. It’s a cue to consider entering a long position.
4 Bearish Engulfing Pattern
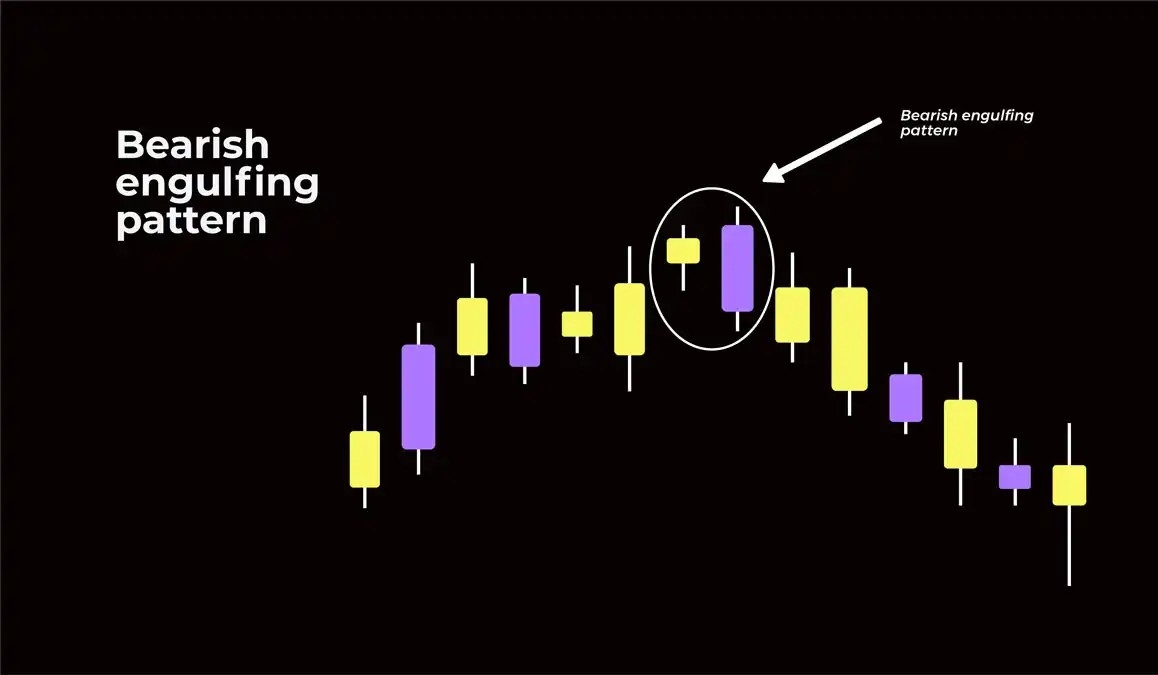
Conversely, the bearish engulfing pattern happens when a small green candlestick is followed by a larger red one. This suggests that sellers have overpowered buyers, indicating a potential downward trend and an opportunity to sell.
5 Bullish Marubozu Pattern
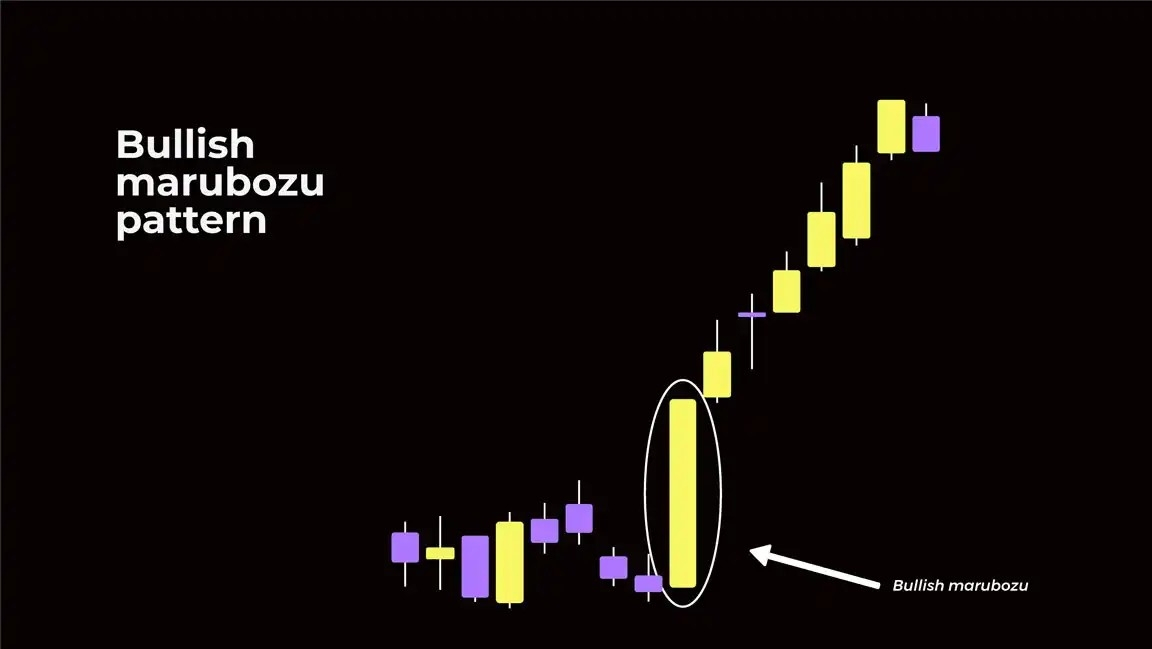
A bullish Marubozu candlestick has no shadows, only a long body, showing that buyers are fully in control from open to close. It’s a strong signal that the bullish trend will continue, making it a good time to hold or enter a new long position.
6 Bearish Marubozu Pattern
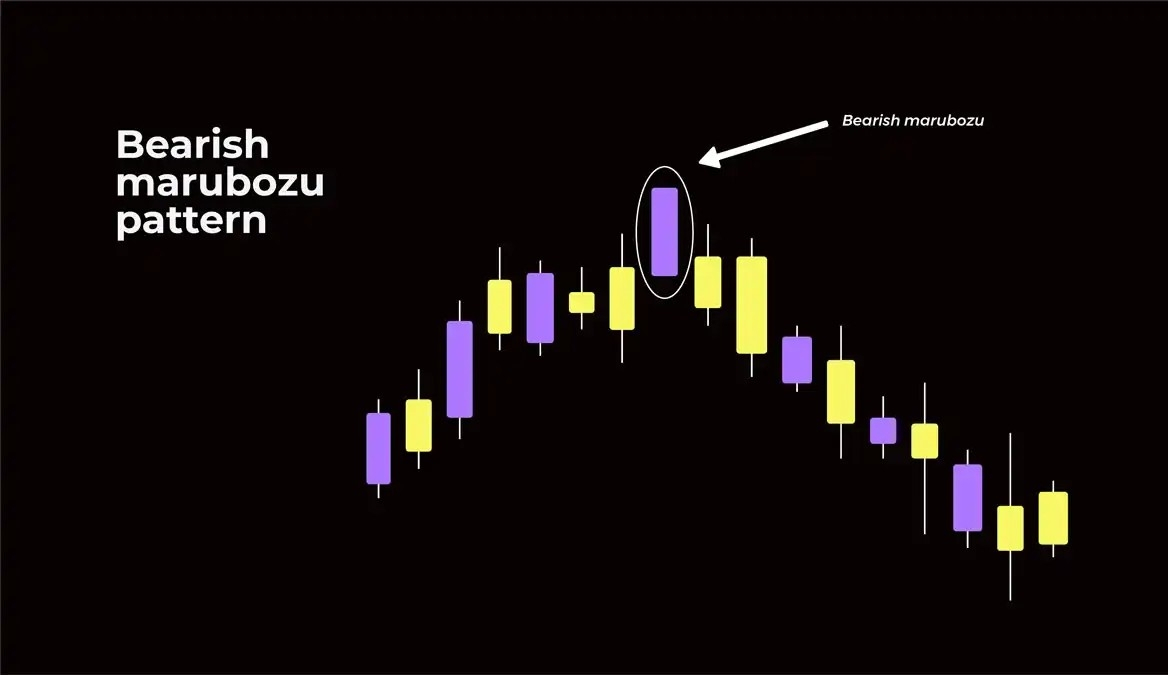
On the flip side, the bearish Marubozu pattern indicates strong selling pressure. The lack of shadows means that sellers dominated from open to close, suggesting a continuation of the downtrend.
7 Doji
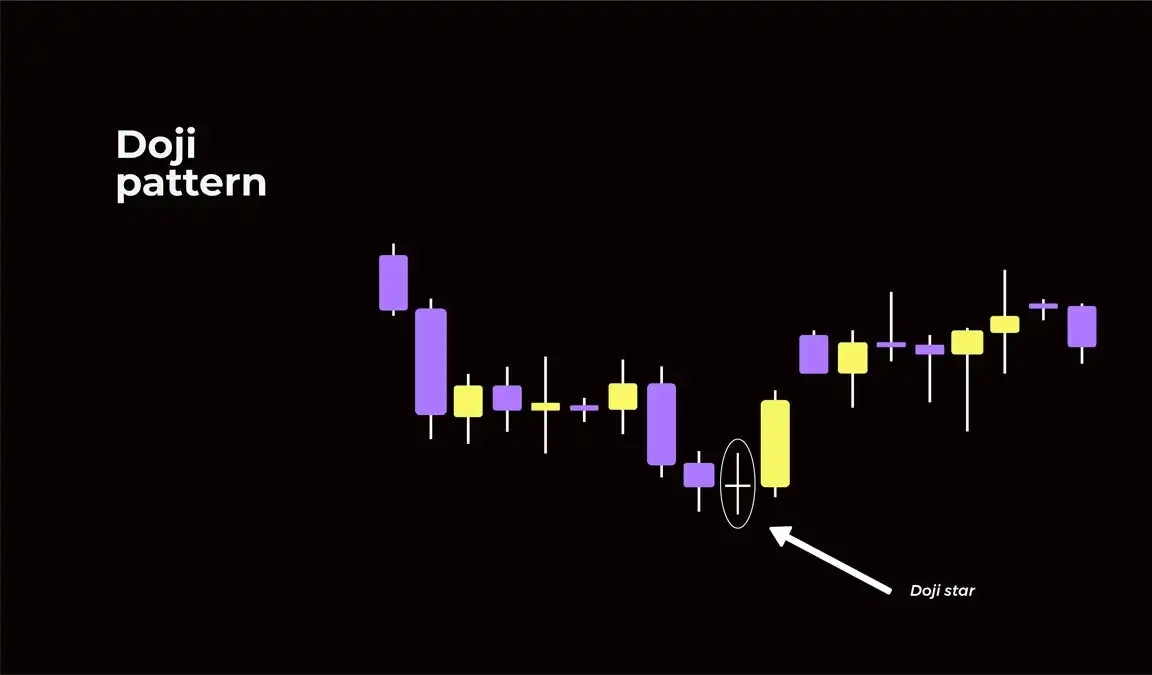
The Doji pattern, characterized by a small body where opening and closing prices are nearly equal, represents market indecision. When combined with other signals, a Doji can hint at a potential reversal, so keep an eye on it.
