From my experience watching markets, the most interesting moves usually start when price becomes very quiet and compressed. This chart is a good example of that moment.
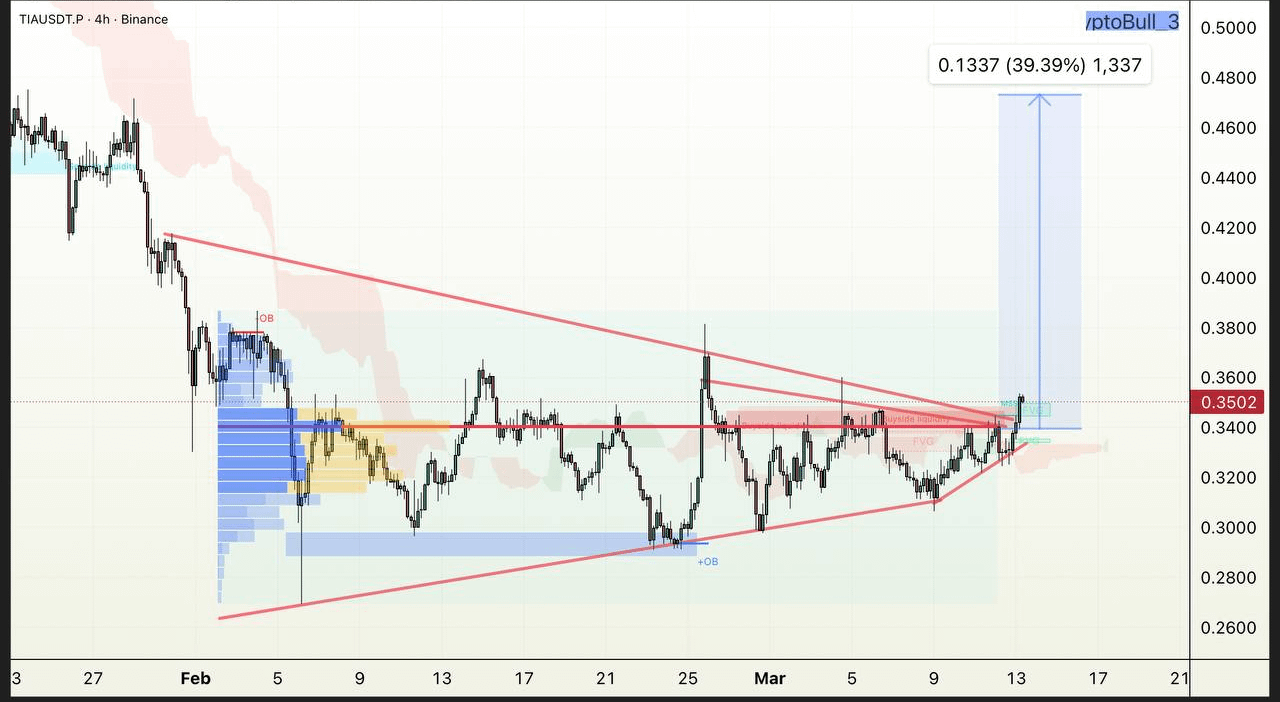
Right now, the asset is moving inside a symmetrical triangle. You can see two red lines slowly squeezing price from both sides. One line is pushing down from the top (resistance), and another is pushing up from the bottom (support).
When markets enter this kind of structure, something important is happening beneath the surface: buyers and sellers are slowly reaching balance.
Each bounce becomes smaller. Each move becomes tighter. It is like pressure building inside a spring.
The horizontal line around $0.34–$0.35 is not random.
If you look closely, price has reacted to this level multiple times.
This tells us something useful:
This level has become a decision zone where both buyers and sellers are active.
Many traders only watch the triangle lines, but experienced traders watch horizontal liquidity zones like this because that is where real orders sit.
The Hidden Clue: Volume Profile
On the left side of the chart there is a volume profile (the blue bars).
This shows where most trading happened in the past.
The thickest area means many people bought and sold there before.
Markets often revisit these zones because they act like memory points for price.
In this chart, that zone sits around $0.32–$0.33, which explains why price keeps bouncing there.
Why the Chart Suggests a Possible Expansion
When price compresses inside a triangle for a long time, volatility becomes very low. Markets rarely stay calm forever.
If price breaks above the triangle resistance, the chart projection shows a potential move toward $0.48 roughly a 35–40% expansion.
But the important lesson here is not the target.
The real lesson is this:
Big moves often start from quiet structures, not from obvious hype.
One Practical Insight Traders Can Learn
Many beginners chase pumps.Experienced traders often do the opposite.
They look for moments where:
• price is compressing
• volatility is shrinking
• structure is forming
Because these are the moments when the next large move is preparing quietly.
This chart is a perfect example of that setup.
$TIA #chartpattern
