Welcome To #LuckySevenTrader 🔥
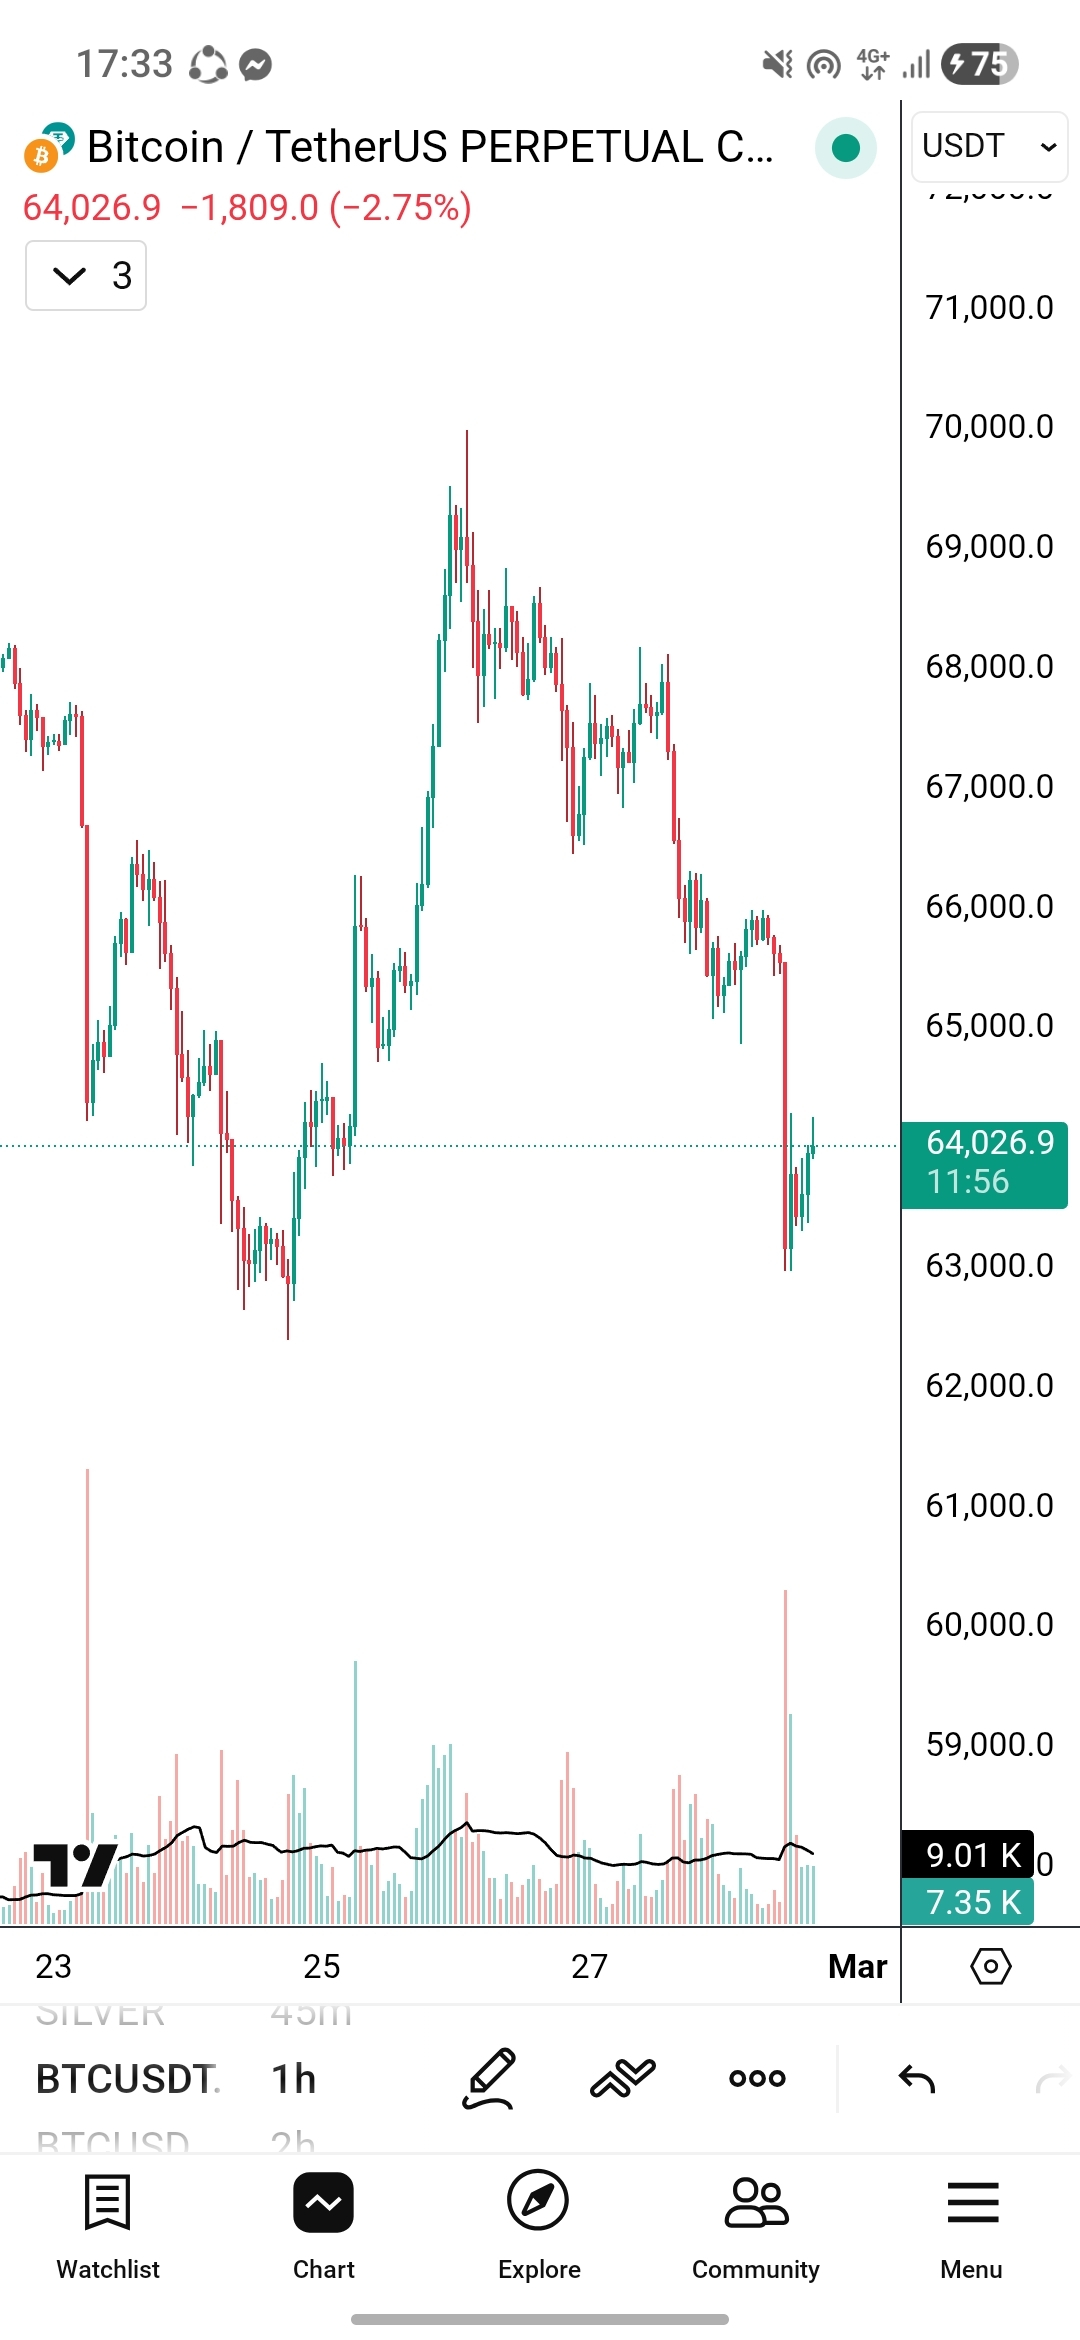
Looking at the 1-hour chart of #Bitcoin against Tether, the market structure is clearly showing lower highs and lower lows, which confirms a short-term bearish trend.
🔎 Market Structure Insight
Price rejected strongly from the $68,500–$69,000 resistance zone.
Continuous lower high formation indicates sellers are still in control.
A sharp drop toward $63,000–$63,300 created panic selling with high volume.
Current price (~$64,000) is just a weak relief bounce, not a confirmed reversal.
Volume spike on the dump suggests strong distribution rather than accumulation.
📉 Trading Plan (Short Bias)
✅ Sell Zone:
$64,300 – $65,200 (resistance retest area)
🎯 Targets:
TP1: $63,000
TP2: $62,200
TP3: $60,800 (if momentum increases)
🛑 Stop Loss:
Above $66,000
Risk management is key — don’t overleverage.
⚠️ Alternative Scenario (Bullish Invalidation)
If BTC breaks and closes above $66,500 on 1H with strong volume, then the short setup becomes invalid and we may see a move toward $68,000 again.
🧠 Final Thought
Right now, trend is your friend — and the trend is bearish on the 1H timeframe. Until a clear higher high forms, rallies are likely to be selling opportunities.
Trade smart. Stay disciplined. Protect your capital.