🚀 SOL Surges 12% – Momentum Strong, But Is It Sustainable?
Over the last 24 hours, SOL has made an impressive move, climbing nearly 13% and catching strong market attention. The short-term trend looks clearly bullish, with the 7-period EMA trading above the 25 and 99 EMAs, confirming strong upward momentum.
Institutional interest is also increasing. U.S. spot Solana ETPs have reportedly absorbed around 1.55% of the total supply, with fresh inflows of nearly $8 million in a single day. This kind of accumulation can tighten circulating supply and support price strength.
On the ecosystem side, Solana continues gaining traction — especially in AI-focused commerce projects — thanks to its high speed and low transaction fees. A Solana-based prediction platform recently raised $3 million, adding to the network’s growth narrative.
⚠️ But Here’s Where Caution Is Needed
Despite the bullish momentum, technical indicators suggest the market may be overheated in the short term.
All major short-term RSI levels (6, 12, and 24 period) are above 70, with RSI6 near 77, indicating overbought conditions. This doesn’t guarantee a drop — but it increases the probability of a pullback or short consolidation.
Additionally, there are market rumors regarding possible insider trading concerns within a related exchange ecosystem. Even speculation like this can temporarily shake investor confidence and increase volatility.
Another factor to watch is treasury pressure: a major holder is reportedly sitting on a large unrealized loss this month. If liquidation occurs, it could introduce short-term selling pressure.
💬 Community Sentiment
Sentiment is mixed.
Many traders remain bullish and see dips in the $80–$90 zone as buying opportunities. However, some short-term traders believe the rally may be overstretched and are positioning for a correction.
📊 Final Take
Technically, SOL remains strong in the short term, supported by momentum and institutional flows. However, overbought conditions suggest caution.
If momentum continues and resistance breaks with volume → further upside possible.
If RSI cools down → expect short-term correction before the next leg higher.
Smart traders don’t chase blindly — they wait for confirmation.
📌 Chart attached above shows:
• Resistance near $90
• Support zone $80–$82
• Volume spike confirmation
• RSI in overbought territory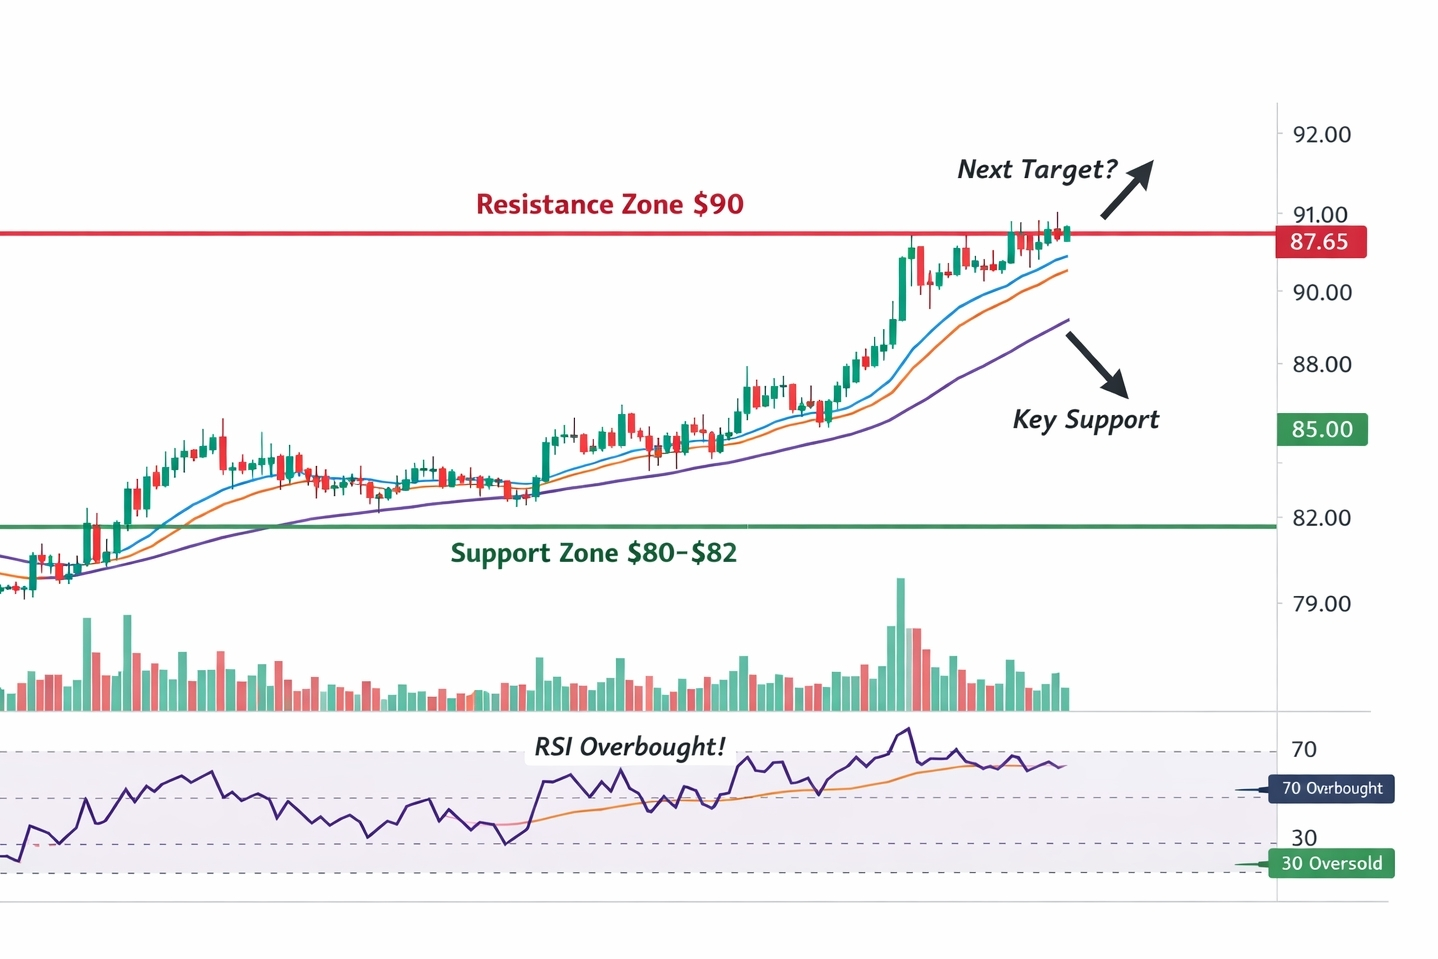
#analysis #CurrentAnalysis #Write2Earn #Write2Earn! #Square $BTC $BNB


