This right here is how the market actually works.
Nobody at the top is using RSI or MACD to make decisions.
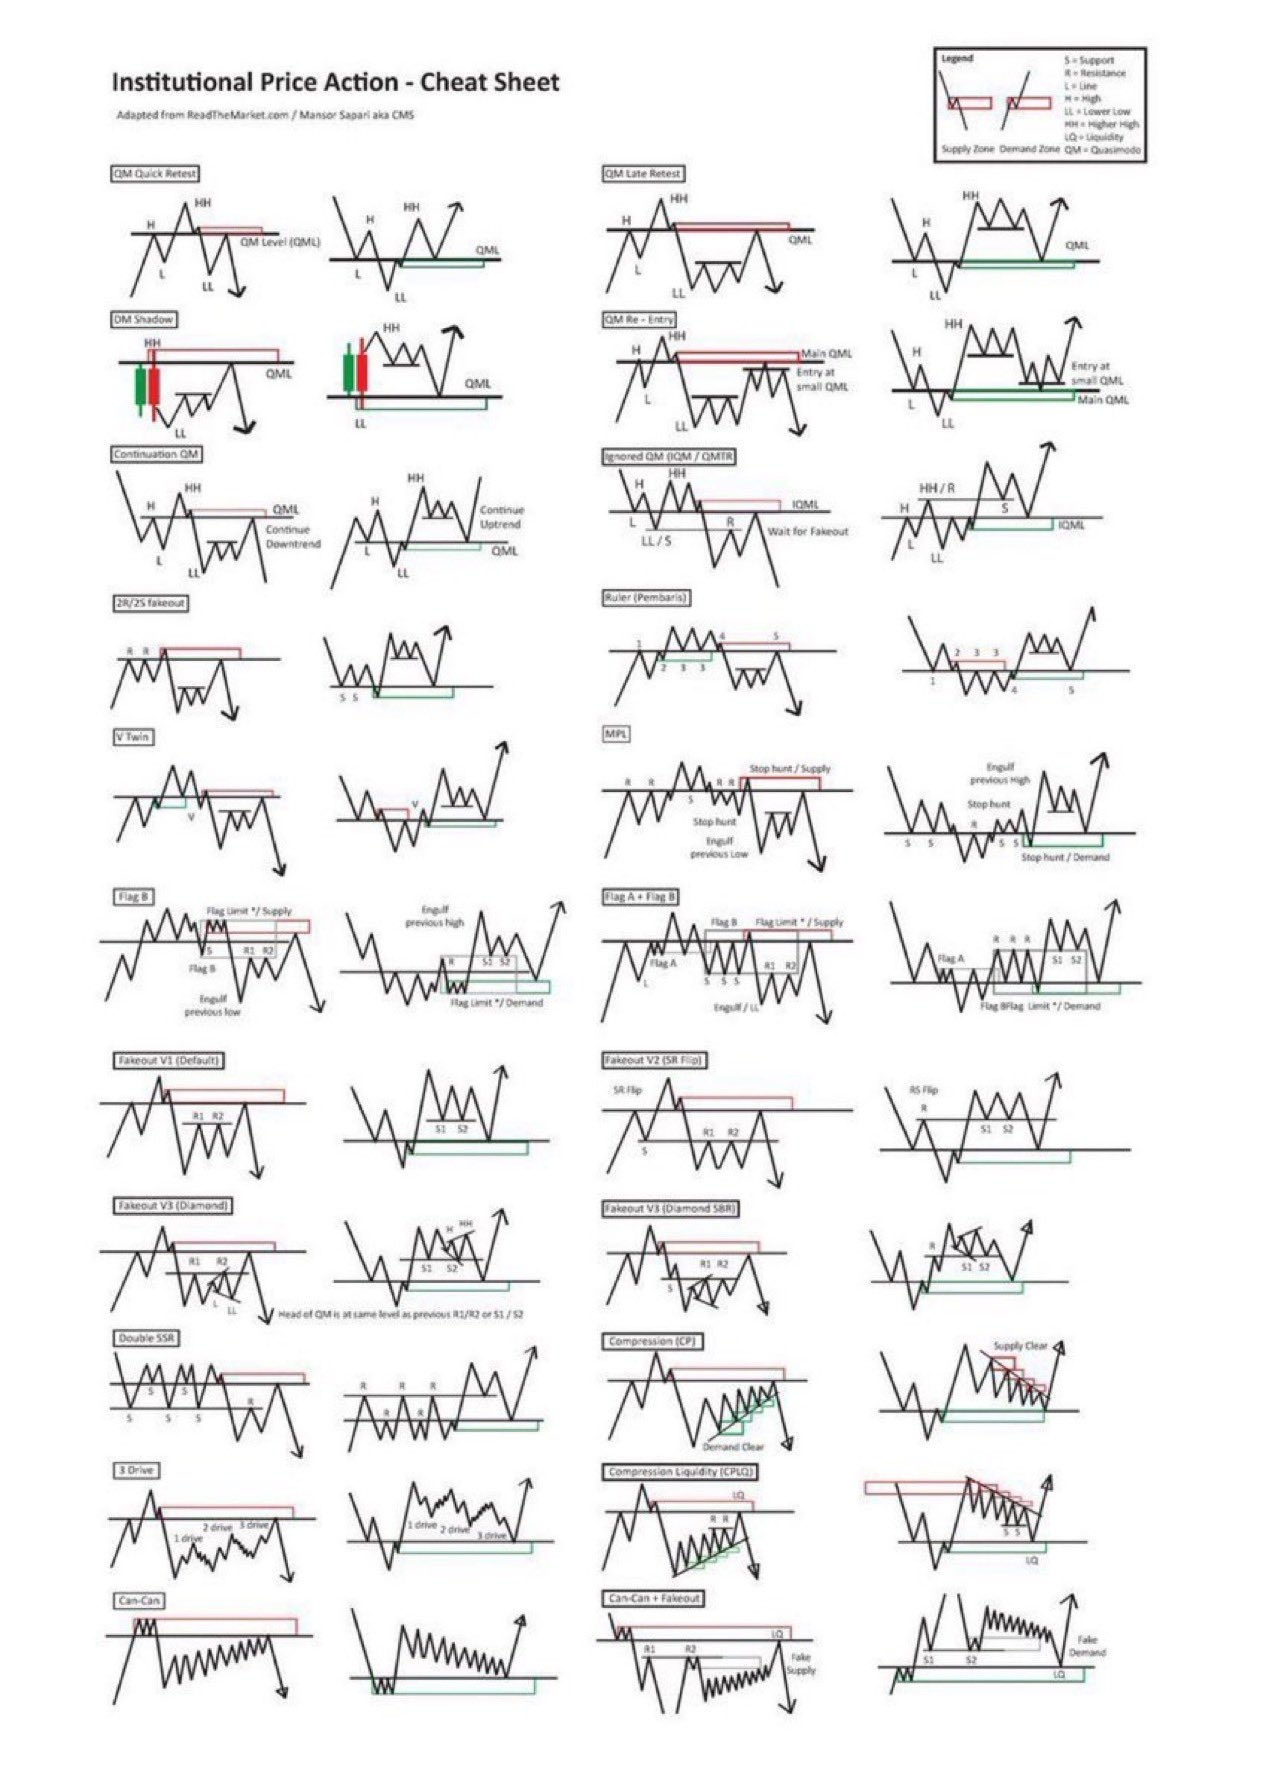
They’re watching where liquidity is, who’s trapped, and how to trigger the next move off those positions.
What throws you off is what they wait for. Same plays, every single week.
– QML setups
– Supply/demand flips
– Fakeouts
– Liquidity grabs
– Compression into expansion
– Stop hunts that look like breakouts
– Flag limits
– Reversal patterns that print over and over
None of it is random.
Every pattern on that image exists for one reason: to push price into zones where the real orders are sitting.
Once you get that, you stop doing dumb shit.
That’s why most traders lose. They react to price. They don’t understand why price is doing what it’s doing.
People who survive this market spent years staring at charts like this until it finally clicked.
After that, everything got slower and way less emotional.
Save this image, trust me.
If you understand what institutions are doing instead of guessing, you’re already ahead of damn near everyone on here.
I’ve been investing for more than 20 years. I’ve called all the major tops and bottoms publicly.
My next play is almost ready. Follow with notifications before it drops.
Many people will wish they followed me sooner.