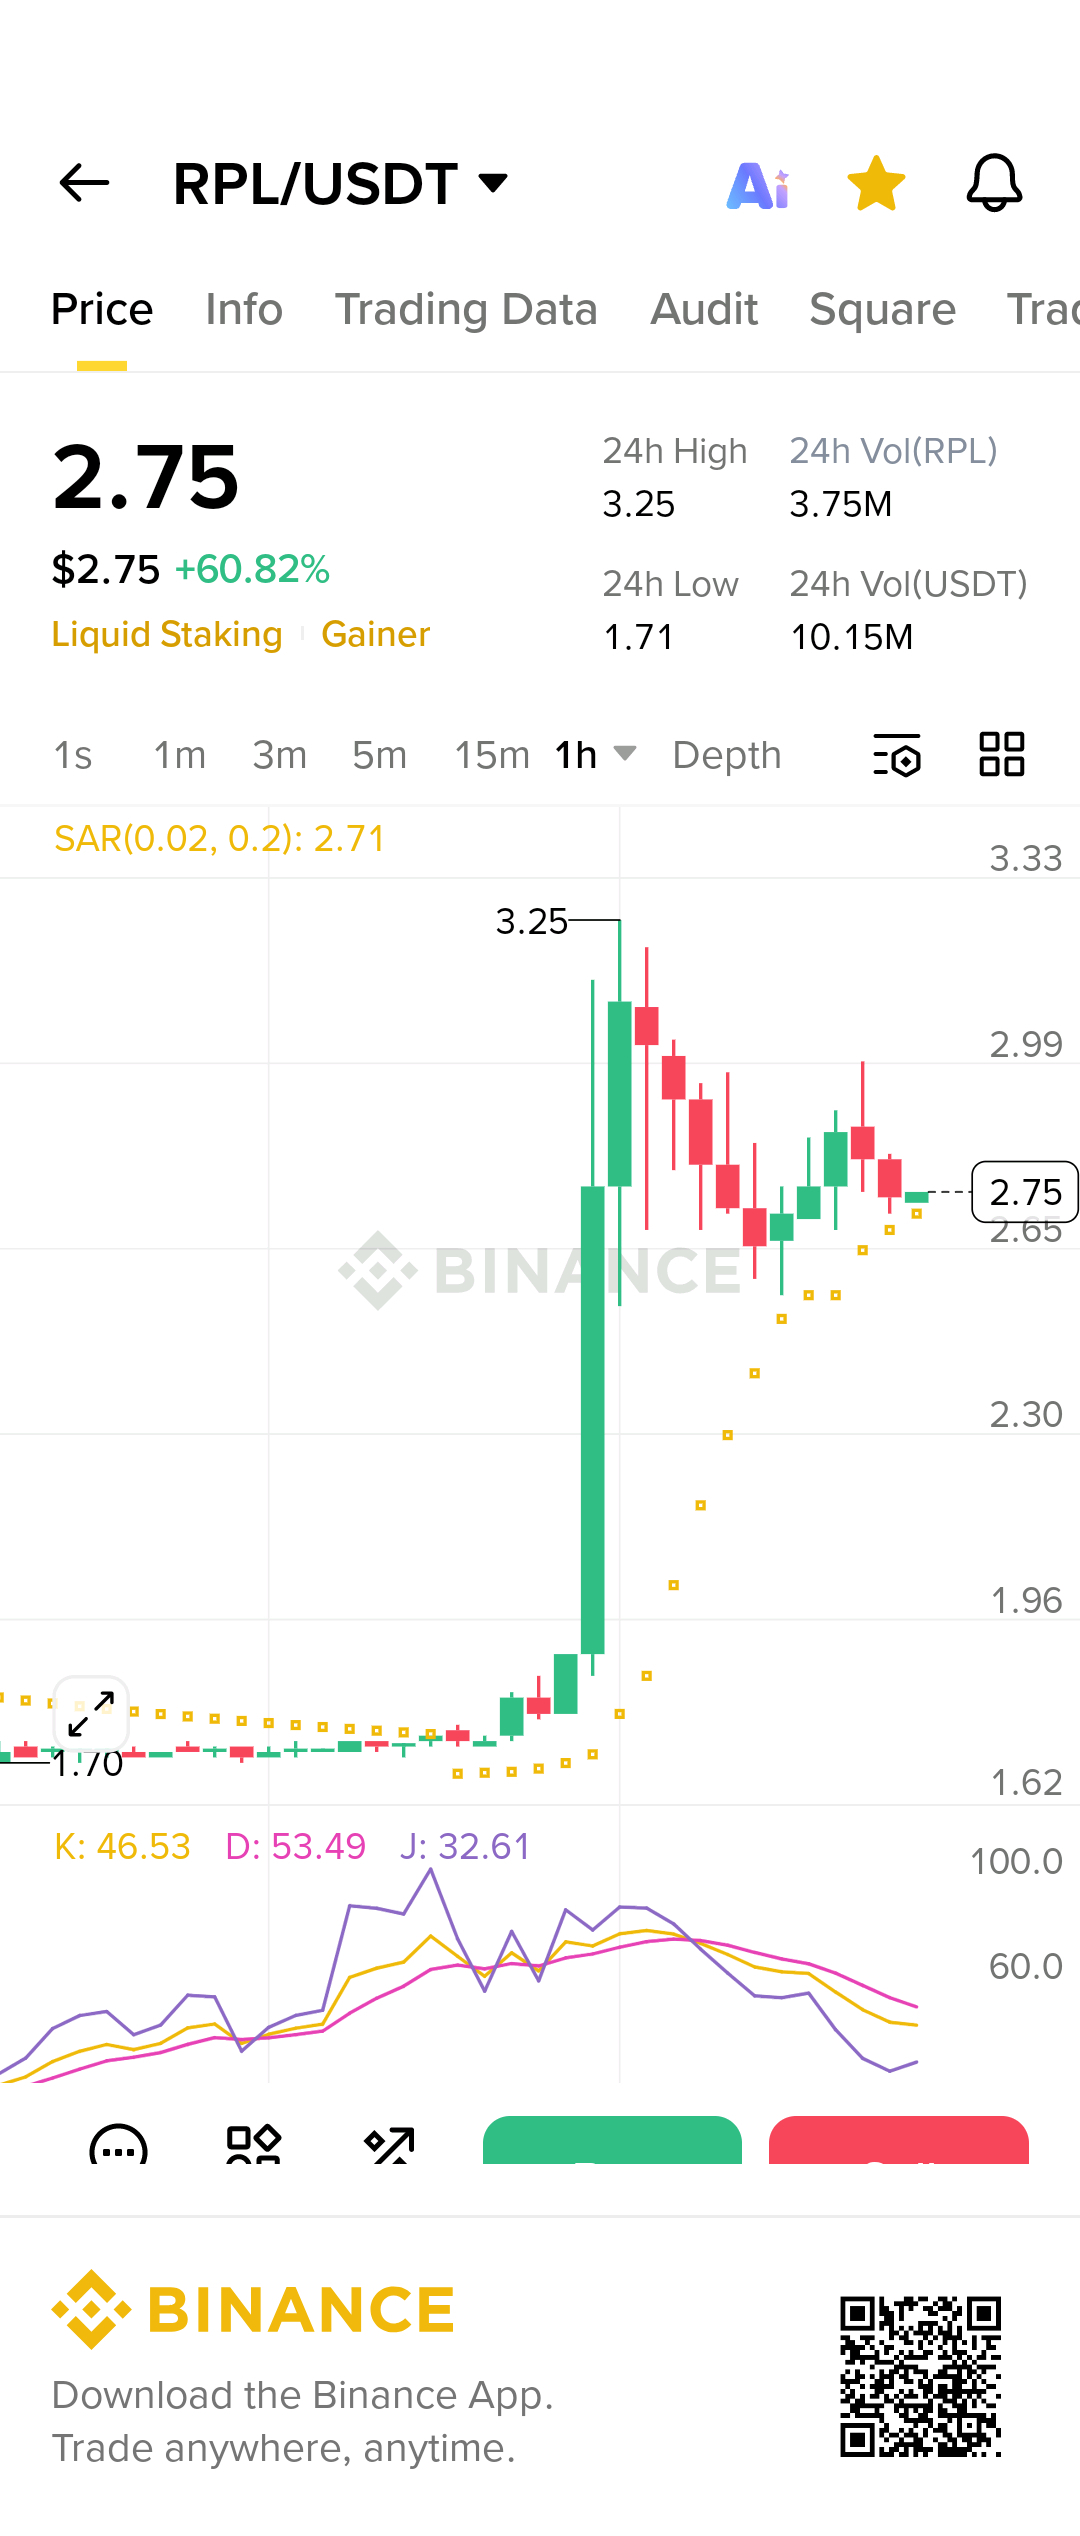
The RPL/USDT pair has shown a massive 60.82% surge, currently trading at $2.75. With a 24-hour high of $3.25 and low of $1.71, the volatility is high, offering potential trading opportunities. Let's break down the technical indicators and key levels to decide where to enter, exit, or consider a short position.
Technical Overview
· SAR (Parabolic Stop and Reverse): Currently at 2.71, slightly below the price. This indicates an ongoing uptrend, suggesting that buyers are still in control.
· Stochastic Oscillator: Values are K:46.53, D:53.49, J:32.61. These are in the neutral zone, meaning the asset is neither overbought nor oversold. This leaves room for further upside or a potential reversal.
· Key Levels: From the chart, immediate resistance is at $2.99 (previous high) and then $3.33. Support lies at $2.65 (recent pullback level) and $2.30.
Trading Strategy
Long Entry
· Entry Point: If the price holds above the SAR level of $2.71 and breaks above the current consolidation, a long entry can be considered near $2.75–$2.80.
· Target: The first profit target is the recent high of $2.99, followed by $3.25–$3.33 if momentum continues.
· Stop Loss: Place a stop loss below the SAR at $2.70 or the next support at $2.65 to limit downside risk.
Short Entry
· Conditions for a Short: If the price fails to break above $2.99 and shows signs of reversal (e.g., bearish candlestick patterns or a drop below SAR), a short could be considered.
· Entry Point: Look for a short entry near $2.90–$2.99 with a stop loss above $3.05.
· Target: Initial downside targets are $2.65 and then $2.30.
Risk Management
Given the recent sharp rally, caution is advised. The market may be due for a pullback, so tight stop losses are essential. Monitor volume and price action closely. If the price remains above SAR, the uptrend is intact; a break below could signal a trend change.$RPL
Disclaimer: This analysis is for informational purposes only and does not constitute financial advice. Always do your own research and trade responsibly.