$BTC slips to $68,402 (📉)** — Why the dip? Short-term profit-taking, weak volume, and macro pressure. Key levels: **Support ~ $68,000**, **Resistance ~ $71,000**. Not investment advice — DYOR. #BTC #Bitcoin #Crypto #Trading
Quick detailed analysis (use for the post body or thread)
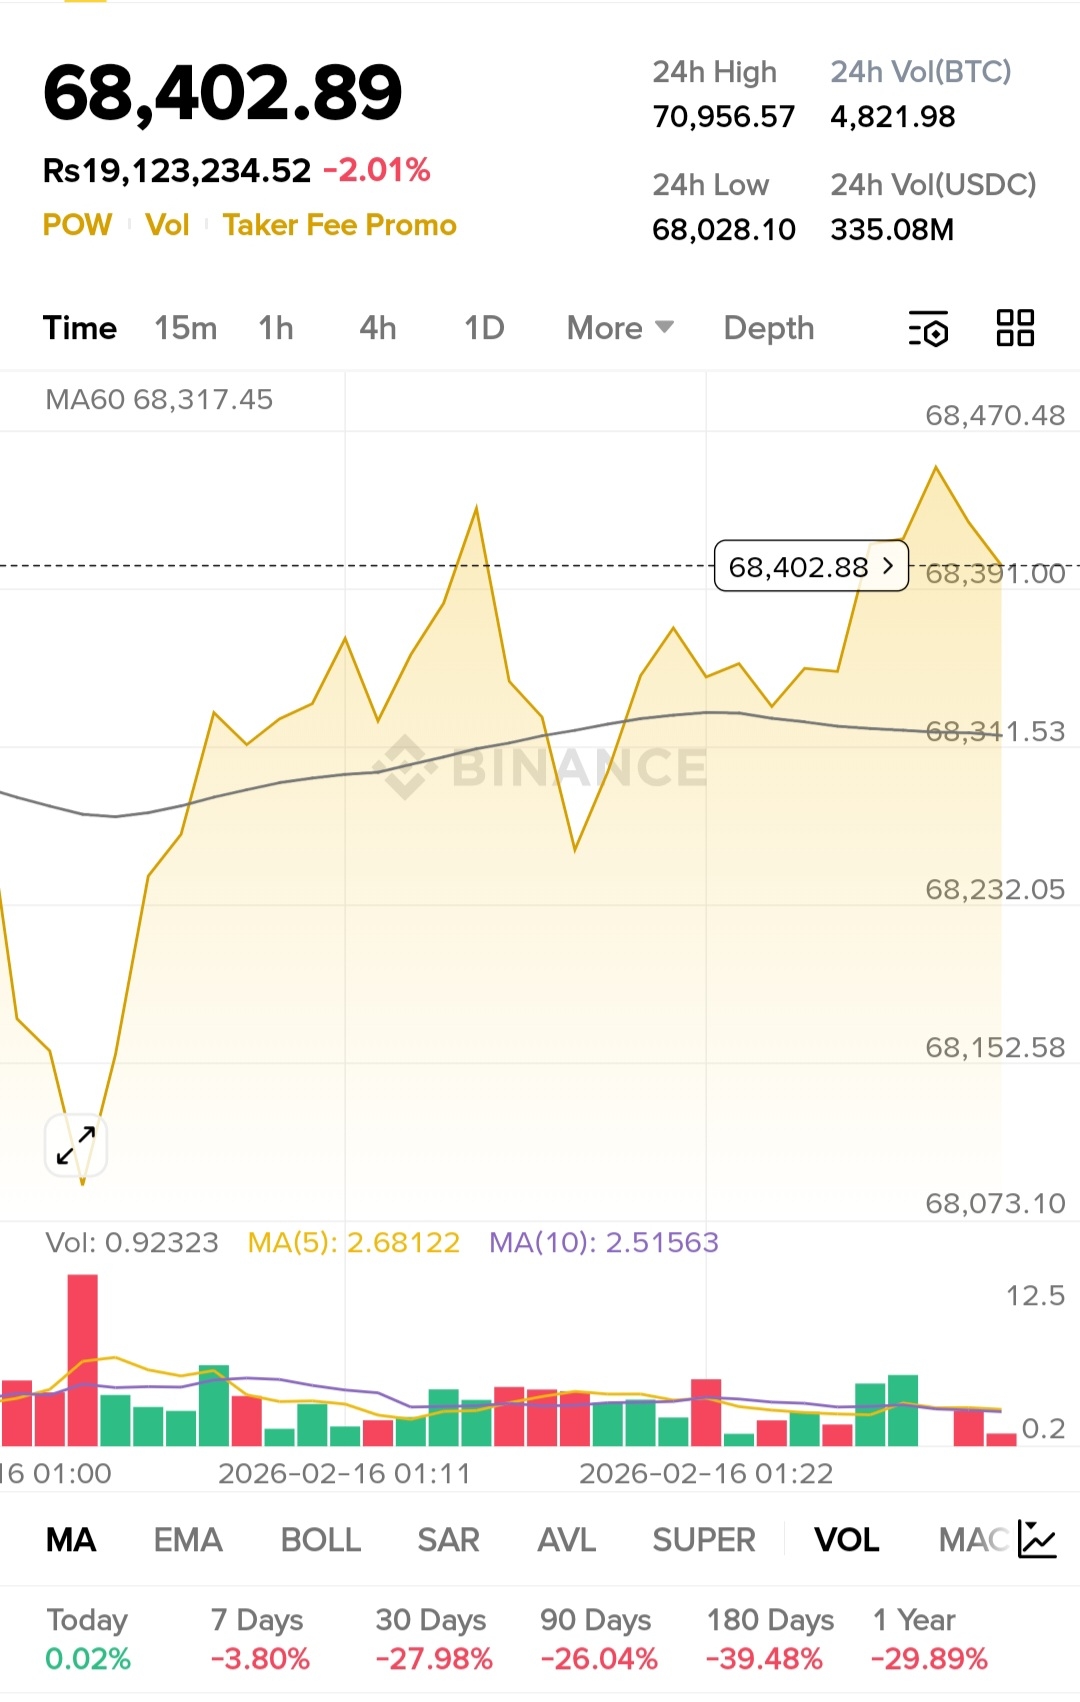
1. Snapshot (from your screenshot)
* Price shown: **$68,402.89**.
* 24h high / low: **$70,956.57 / $68,028.10**.
* MA60 ≈ **$68,317** (price sitting just above the 60–period MA).
* 24h BTC volume ≈ **4,822 BTC** (24h); intraday bars show relatively low local trading volume.
2. Why price ran low — the most likely drivers
* **Profit-taking after recent run** — Bitcoin often gives back gains as short-term traders lock profits near recent highs; the 24h high ~ $71k makes that plausible.
* **Weak immediate volume / poor buying conviction** — the intraday bars show mixed/low volume; dips with low buy-side volume are more likely to drop further because there aren’t strong bids to absorb selling.
* **Technical pressure / moving averages** — price testing the MA60 area. If market participants see that MA as a dynamic resistance/support, they act around it (selling into rallies or closing longs when it breaks).
* **Macro & sentiment factors** — USD strength, bond yields, or headlines (regulation, ETF flows, major liquidation or exchange news) can depress BTC quickly. Even small negative headlines trigger quick moves.
* **Exchange flows & whales** — large inflows to exchanges or visible whale sells can push price down as liquidity absorbs big sell orders. Your screenshot’s 24h volume suggests meaningful activity that could include such flows.
* **Long liquidation cascade risk** — if a quick drop hits common stop levels, automated liquidations can accelerate the sell-off, making the dip deeper before buyers step in.
3. What the chart structure implies (short-term)
* The price is in a **short-term down-to-sideways bias** (7d −3.8%, 30d −28% in screenshot). That shows broader weakness — sellers have been more aggressive over weeks.
* Because price is near MA60, watch whether it **bounces above** or **closes below** it on higher volume — that tells whether buyers are returning.
4. Concrete levels to watch (useable in a post)
* **Immediate support:** $\approx$ **$68,000** (24h low ~ $68,028).
* **Next support if broken:** **$66,000–$67,000** (psychological / recent lower swing area).
* **Immediate resistance:** **$69,500–$70,000** (recent intraday shoulders).
* **Key resistance (short-term):** **$70,956** (24h high) — clearing this would reduce short-term selling pressure.
5. How traders react (education, not advice)
* Bulls wait for **clear confirmation**: higher volume close above resistance or a successful retest of MA with strong buying.
* Bears watch for **failed bounces** and lower highs.
* Important: low-volume rallies are fragile; watch volume for conviction.
Post image / visual suggestion for Square
* Use your current chart crop, highlight three items with small text overlays: **Current: $68,402**, **Support $68k**, **Resistance $71k**. Add one-line reason: “Low volume + profit-taking = dip.” Keep it bold and simple for Scquare feed.
#BTC #Bitcoin #Crypto #CryptoNews #Trading #BTCUSDC #Binance

#TechnicalAnalysis
Risk reminder (must include)
> **Not financial advice.** This is market analysis only — always do your own research and size risk responsibly.