Bitcoin (BTC) and Ethereum (ETH) Heatmap, Trading Signals, and Charts – February 15, 2026Current Prices and Market Snapshot
Bitcoin (BTC): ≈ $69,000–$70,400 USD (real-time fluctuations across sources)
Ethereum (ETH): ≈ $2,000–$2,070 USD
Overall Crypto Market
Total market cap: ≈ $2.42 trillion (+1.4% in the last 24h)
24h trading volume: ≈ $103 billion
BTC dominance: ≈ 58.3%
ETH dominance: ≈ 10.3%
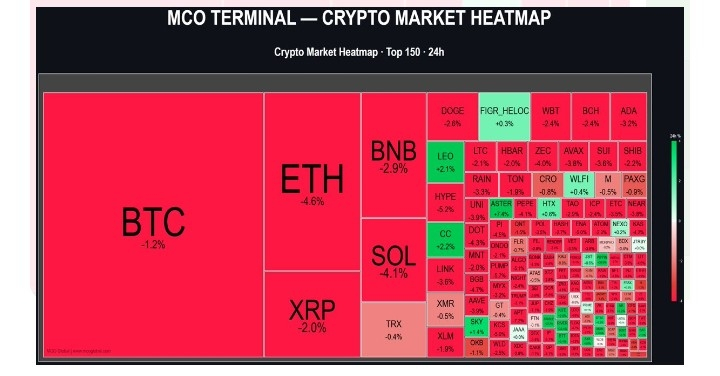
Prices and percentages are live and can shift quickly; the data below reflects the most recent consistent snapshots from major trackers.Performance “Heatmap” (Timeframe % Changes)This is the classic crypto heatmap view: color-coded gains/losses over multiple periods (green = gains, red = losses). Data primarily from CoinGecko, cross-checked with CoinMarketCap and others.Bitcoin (BTC)
1h: +0.1%
24h: +0.9% to +1.0%
7d: +3.1%
14d: +11.8%
30d: +27.7%
1y: +29.4%
Ethereum (ETH)
1h: +0.4%
24h: +3.5% (some snapshots show –0.6%)
7d: +6.1%
14d: +16.5%
30d: +39.5%
1y: +26.2%
In live market heatmaps, BTC is always the largest tile (by far the biggest market cap). ETH is the second-largest. Colors shift in real time — BTC has been light green in recent snapshots (+1%), while ETH has toggled between light green and neutral/light red depending on the exact hour.Here are real examples of current-style crypto heatmaps (tiles sized by market cap, colored by 24h performance):
Technical Analysis)Bitcoin (BTC) – Investing.com summary (latest check)
Overall: Strong Sell
Moving Averages: Sell (3 Buy vs 9 Sell)
Technical Indicators: Strong Sell (1 Buy vs 7 Sell)
Key levels (Classic Pivot):
Support: $68,607 / $68,287 / $67,785
Resistance: $69,429 / $69,931 / $70,251
Current price was hovering near the pivot (~$69,046 in that snapshot).
Ethereum (ETH) – Investing.com summary
Overall: Strong Sell
Moving Averages: Strong Sell (0 Buy, 12 Sell)
Technical Indicators: Strong Sell (0 Buy, 7 Sell)
RSI(14) ≈ 28 → oversold territory
MACD, STOCH, Williams %R, CCI all flashing Sell
Key levels (Classic Pivot):
Support: ≈ $1,990–$1,978
Resistance: ≈ $2,020–$2,037
Current price was near $2,003 with recent downside pressure.
Short-term view (1h–daily): Bearish bias on both assets (majority of indicators and MAs are Sell).
Medium-to-longer-term view (weekly+): Still constructive — both assets are up strongly over 14–30 days and remain in broader bull cycles (BTC +29% YoY, ETH +26% YoY).Additional Trading Note – Liquidation Heatmaps
Many traders also watch liquidation heatmaps (e.g., on CoinGlass, CoinAnk, Binance) that show where large clusters of leveraged positions would get wiped out. These zones often act as magnets for price. BTC and ETH liquidation pools are currently visible in the $68k–$72k and $1,950–$2,100 ranges respectively, depending on the exchange and leverage.Charts – Recent Price Action SummaryBitcoin
Strong recovery over the past 30 days (+27–28%).
Currently in a consolidation/pullback phase after testing higher levels.
Longer-term trend remains bullish (well above 2024–2025 lows).
Ethereum
Even stronger 30-day performance (+39%).
More volatile in the past 24–48h with some profit-taking.
Still trading well below its 2025 all-time high but in a clear uptrend on weekly/monthly charts
Heatmap: BTC dominant and mostly positive short-term; ETH second-largest with solid multi-week gains.
Signals: Short-term technicals lean Strong Sell on both (watch the pivot levels).
Trend: Longer-term bullish for both assets.
Always use proper risk management — crypto moves fast!