The cryptocurrency market is once again focusing on XRP as several technical indicators suggest the potential for a significant price breakout. Analysts are closely watching XRP’s chart patterns and on-chain data, which together indicate that the asset could be preparing for a strong upward move in the coming days.
Bollinger Bands Hint at High Volatility
One of the key indicators currently attracting attention is the Bollinger Bands. Recently, the bands on XRP’s chart have started to tighten, a condition often referred to as a “squeeze.” This typically signals that market volatility is decreasing temporarily and a strong price movement may follow.
Historically, when Bollinger Bands compress like this, it often precedes a large breakout. Market analysts believe that if bullish momentum continues, XRP could experience a sharp price expansion once volatility returns.
Falling Wedge Pattern Targets $2.55
Another bullish signal appearing on XRP’s chart is the formation of a falling wedge pattern. This pattern is widely recognized in technical analysis as a bullish reversal structure. It forms when price gradually moves downward within converging trend lines before eventually breaking upward.
If XRP successfully breaks out of this wedge pattern, analysts estimate a potential target around $2.55. However, the key resistance zone that traders are watching lies near $1.55–$1.65. A confirmed breakout above this range could trigger a strong rally toward higher price levels.
Exchange Outflows Indicate Accumulation
Beyond technical indicators, on-chain data also supports a bullish outlook for XRP. Recent data shows that XRP balances on major cryptocurrency exchanges have been declining. This trend suggests that investors are moving their tokens off exchanges into private wallets, a behavior commonly associated with long-term holding and accumulation.
When exchange balances decrease, it typically reduces immediate selling pressure in the market. Combined with increasing demand, this can create favorable conditions for price appreciation.$XRP 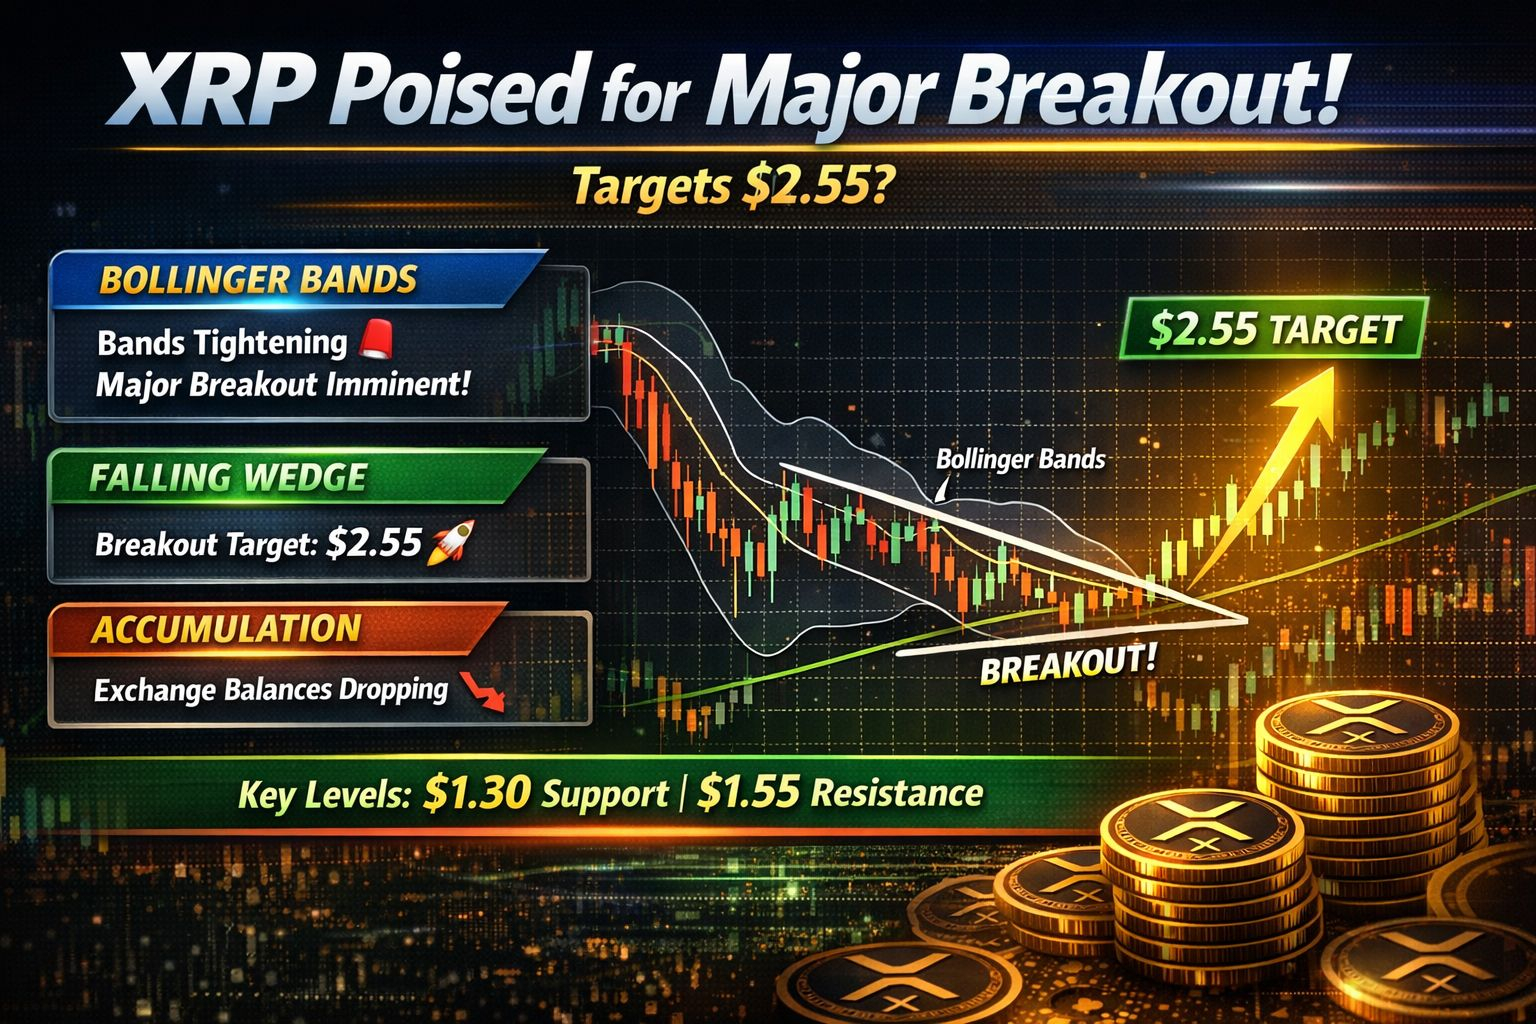 $XRP
$XRP
Key Levels to Watch
For traders and investors, several key levels are important in the short term:
Support Level: $1.30
Major Resistance: $1.55
Bullish Target: $2.55
If XRP breaks above the resistance zone with strong volume, it could confirm the bullish scenario and open the path toward the projected target.
Conclusion
With Bollinger Bands signaling an upcoming volatility expansion, a falling wedge pattern indicating a potential bullish breakout, and on-chain data showing ongoing accumulation, XRP appears to be approaching a decisive moment. While market conditions can always change, current indicators suggest that XRP may soon experience a significant price movement that traders should closely monitor.
Disclaimer: This article is for informational purposes only and should not be considered financial advice. Cryptocurrency investments involve risk, and investors should conduct their own research before making decisions.$XRP