📈 Bitcoin Turns Green Again in March — A Potential Shift in Momentum
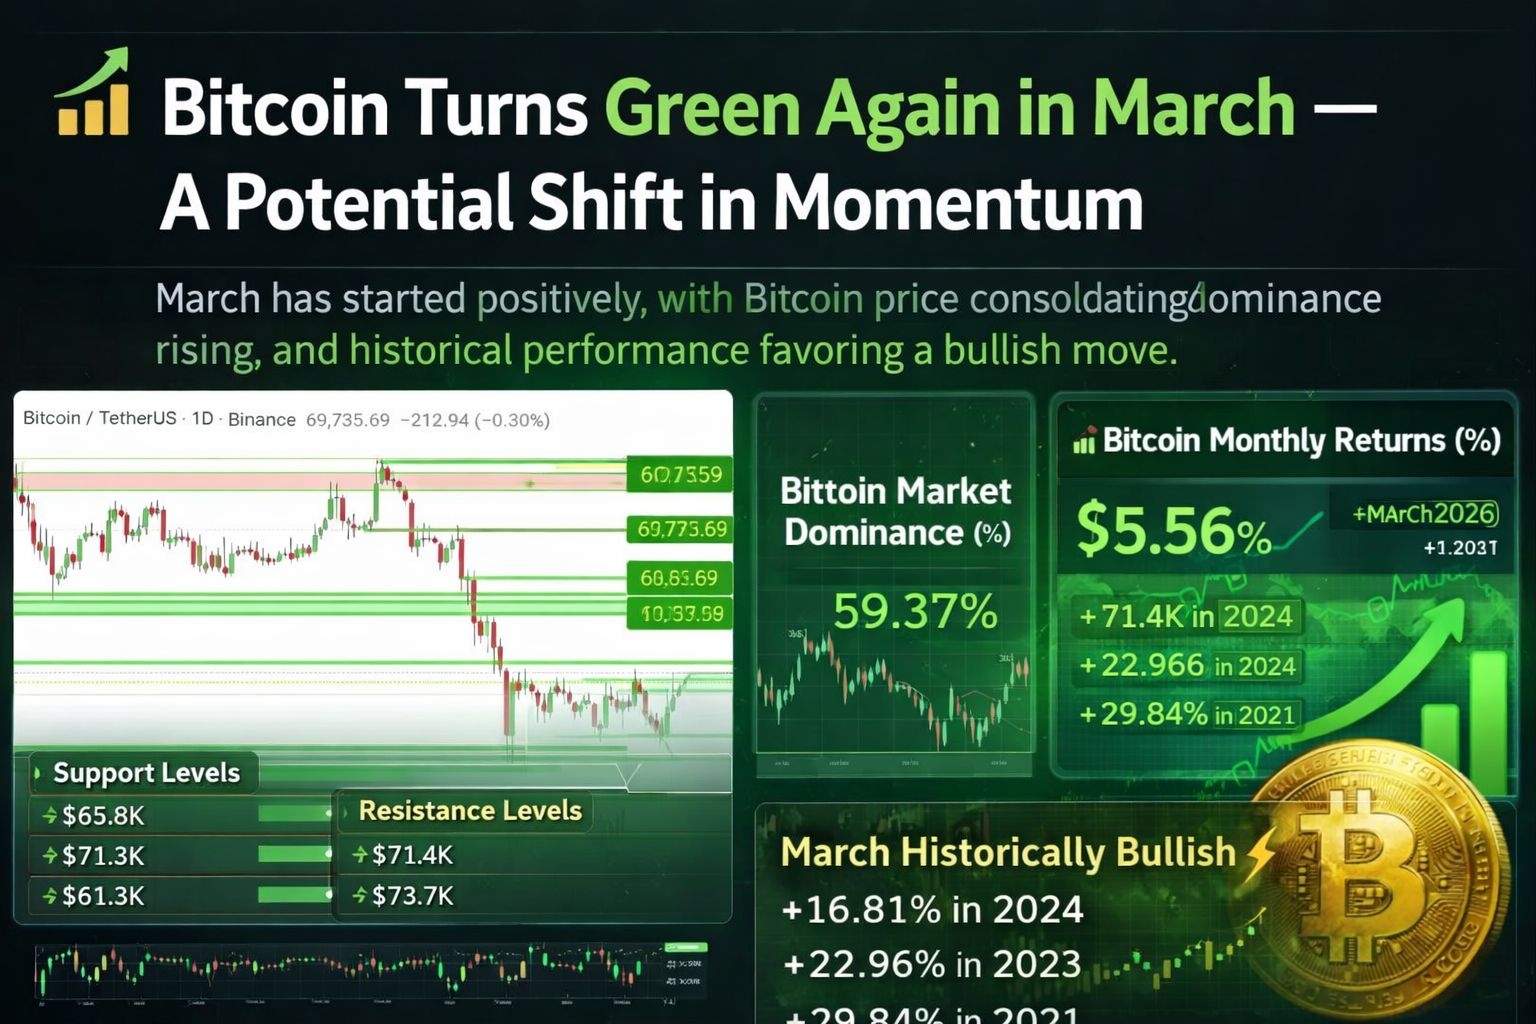
March is starting to look promising again for Bitcoin, with multiple indicators suggesting that the market could be preparing for a stronger move. Recent technical charts, market dominance data, and historical performance trends all hint that the current month may once again favor the bulls.
📊 Bitcoin Consolidating After a Major Correction

The BTC/USDT daily chart on Binance via TradingView shows Bitcoin trading around $69,700 after experiencing a sharp correction earlier in the year.
Key observations from the chart:
* Price dropped aggressively from the $90K+ region.
* Bitcoin is now consolidating between strong support and resistance levels.
* Major support zones sit around:
* $65,800
* $61,300
* $58,900
Resistance levels are stacked above:
* $71,400
* $73,700
* $74,600
* $80,400+
This consolidation often occurs before a strong breakout move. The current structure suggests Bitcoin may attempt to reclaim the $71K–$74K range if buyers maintain pressure.
🧭 Bitcoin Dominance Suggests Capital Rotation
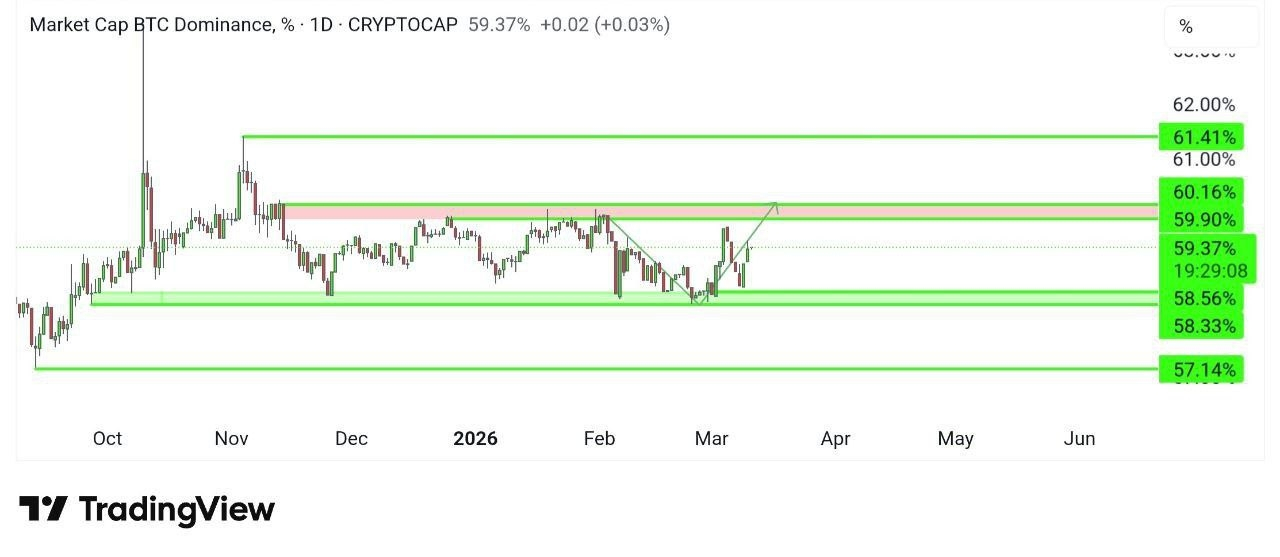
The Bitcoin Dominance chart shows BTC dominance currently around 59.37%.
Important signals:
* Dominance recently bounced from a strong support zone near 58.5%.
* It is now pushing toward the 60%–61% resistance area.
* If this resistance breaks, Bitcoin could capture more market share from altcoins.
Historically, rising dominance often means capital flows first into Bitcoin before moving to altcoins later in the cycle.
📅 March Historically Favors Bitcoin
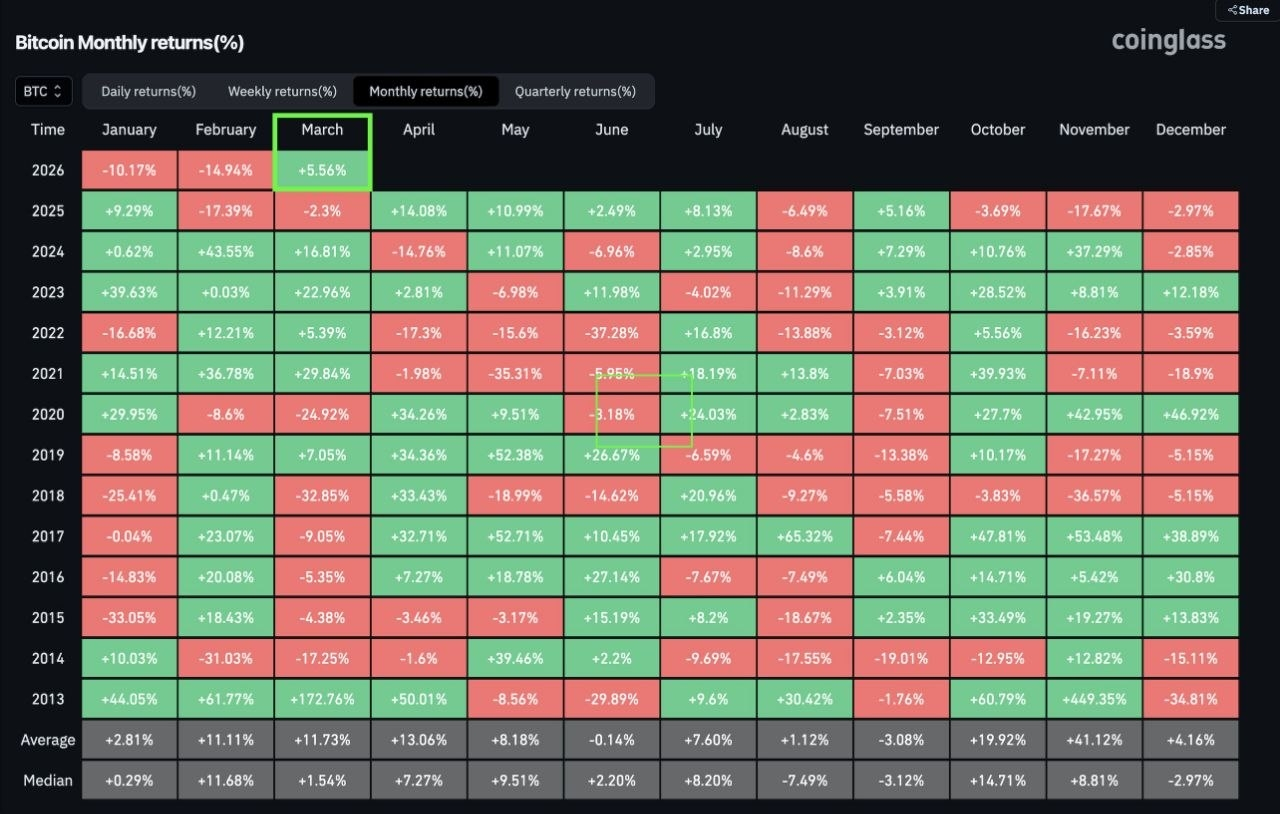
Historical data from Coinglass reveals that March has been one of Bitcoin’s stronger months on average.
Average monthly returns:
* Average March return: +11.73%
* Median return: +1.54%
For 2026, the month has already turned positive with roughly +5.56%, signaling a potential continuation of the trend.
Looking back:
* 2023: +22.96%
* 2024: +16.81%
* 2022: +5.39%
* 2021: +29.84%
This consistency makes March statistically one of the more favorable months for BTC momentum.
🔍 What Could Happen Next?
If the current structure holds, a possible scenario for Bitcoin could be:
1. Short consolidation around $69K–$71K
2. Breakout toward $73K–$75K
3. Retest of $80K+ liquidity zones
However, if support fails:
* Bitcoin could revisit $65K
* A deeper pullback might test $61K
For now, the market appears to be building a base rather than continuing the downtrend.
🚀 The Bigger Picture
Several factors make March particularly interesting:
* Strong historical performance
* Consolidation after a correction
* Rising Bitcoin dominance
* Liquidity zones above current price
If momentum continues, March could mark the beginning of the next upward leg in the Bitcoin cycle.
✅ Conclusion:
With technical support holding, dominance rising, and historical data favoring bullish performance, March is once again shaping up to be a green month for Bitcoin. While volatility remains part of the market, the current signals suggest that BTC may be preparing for its next move higher.
👍👍👍 Please follow me, repost, like this post and comment. If you follow me then you will get back 💯% 👍👍👍
#bitcoindominanacecycle #cryptosignals #btc70k #MarchHistorically