Bitcoin continues to hover near an important technical area as traders closely monitor liquidity zones and indicator support to determine where the next major move might develop. The market is currently showing signs of consolidation rather than a decisive trend, with price holding above a key structural level while liquidity pockets above and below continue to influence expectations.
At the moment, Bitcoin $BTC is trading close to 69,500, reflecting a decline of roughly 1.9 percent during the current trading session. The market briefly dropped toward the 69,400 area while the intraday high extended to nearly 71,600 before sellers stepped in. That quick rejection from higher levels suggests the move was not strong enough to sustain a breakout and instead triggered profit-taking from short-term traders.
After failing to remain above the 71,600 region, Bitcoin gradually drifted lower and began compressing toward the bottom of its recent trading range. This type of movement often reflects hesitation in the market, where buyers and sellers are both waiting for stronger confirmation before committing to a larger directional push.
Looking at broader performance, Bitcoin still maintains a positive short-term outlook. Over the past two weeks the asset has gained approximately 6.9 percent, showing that buyers have been able to regain some momentum following previous weakness. However, the weekly structure remains relatively flat, while the monthly performance is down about 1.6 percent. When measured over a longer time frame, Bitcoin is still trading roughly 13.5 percent lower than it was one year ago.
This mixed performance across timeframes indicates that Bitcoin is currently moving through a phase of price reassessment rather than an aggressive trending environment. Markets often enter these periods after strong directional moves, where short-term rebounds encounter selling pressure and traders reassess valuation before the next major expansion phase begins.
A key element supporting the current structure is the Parabolic SAR indicator, which is positioned significantly below the current market price near the 64,000 level. With Bitcoin still trading well above this support zone, the broader bullish structure remains technically intact. As long as price maintains distance from that indicator level, the market can still be interpreted as consolidating rather than reversing.
Volatility conditions also play a critical role in shaping the current market environment. The 20-day standard deviation is sitting near 1,998, which represents a noticeable decrease compared to the sharp volatility spike that occurred during the February selloff. Lower volatility typically signals that panic activity is fading and the market is entering a calmer consolidation phase.
When price movement becomes quieter in this way, it often reflects a transition from chaotic selling or buying toward a more balanced trading range. While reduced volatility does not guarantee an immediate upward breakout, it does indicate that the market may be forming a structural base where future momentum can develop.
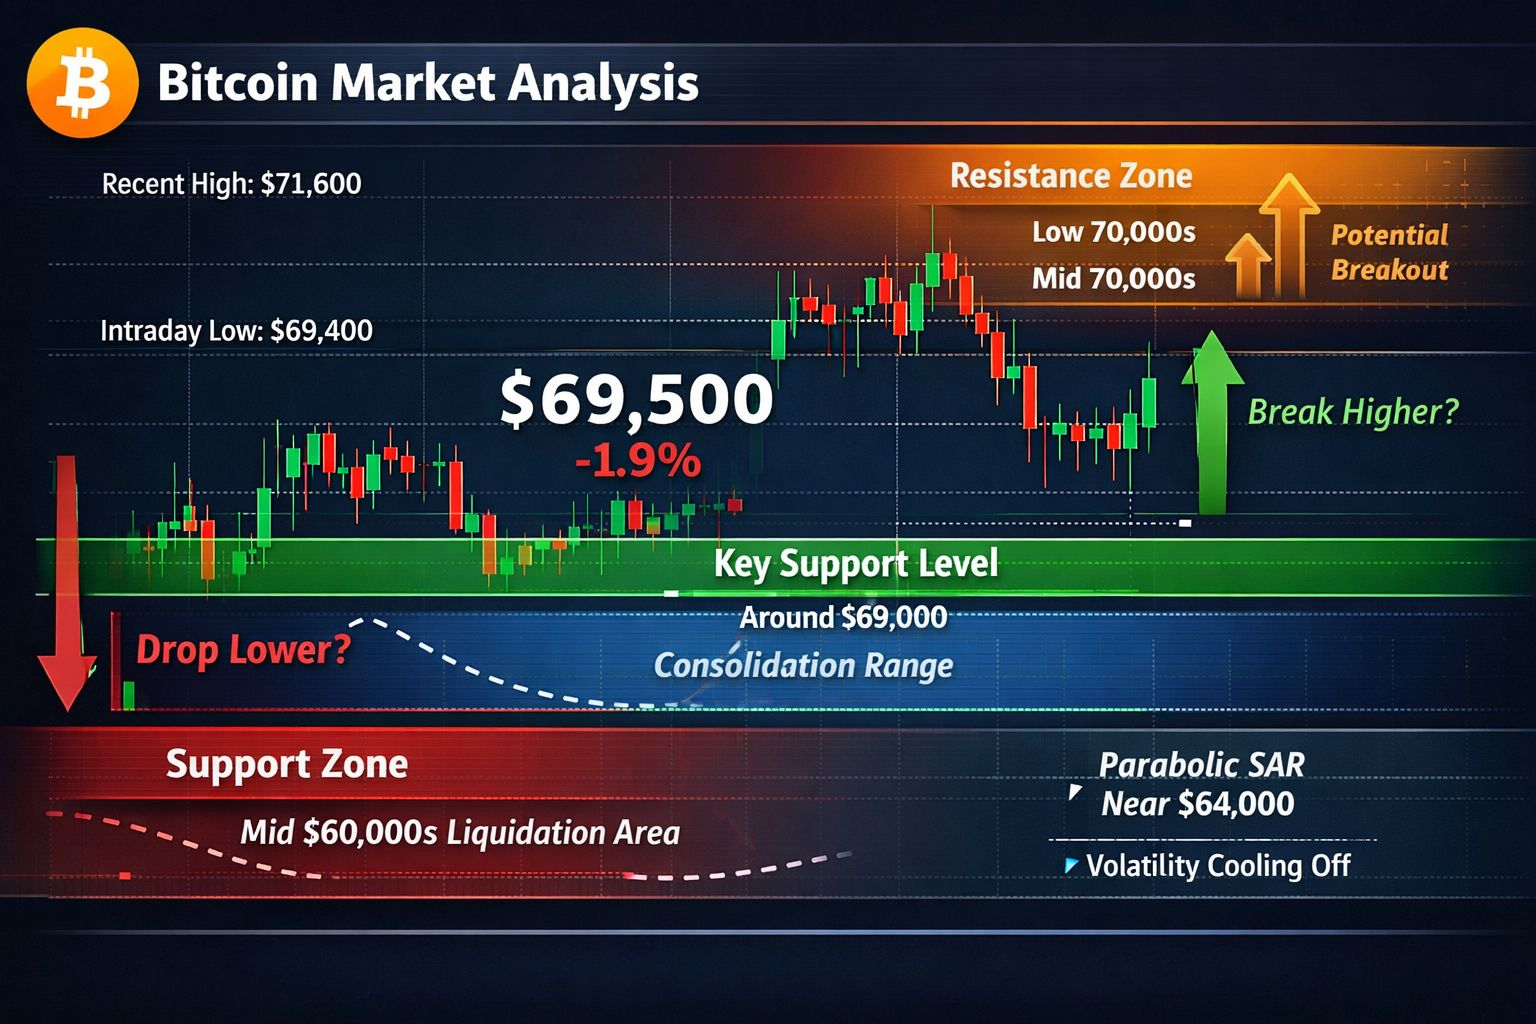
Another important component shaping the near-term outlook is liquidity positioning. Liquidation heatmap data from Binance’s BTC/USDT market highlights several clusters where leveraged positions are concentrated. Above the current price, strong liquidation zones appear in the low 70,000 region as well as another concentration closer to the mid-70,000 range.
These liquidity pockets can act like magnets for price movement because large clusters of leveraged positions often trigger cascading liquidations when they are reached. If bullish momentum begins to strengthen, these zones could attract price upward as short positions are forced to close.
On the other hand, the downside also contains an important liquidity region around the mid-60,000 level. Should selling pressure increase or the current support begin to weaken, the market could move toward that zone as traders’ stop losses and leveraged positions become activated.
For now, Bitcoin remains positioned between these major liquidity areas while holding above key technical support. The coming sessions will likely determine whether the current compression evolves into a bullish continuation toward higher liquidation zones or if sellers regain control and push the market back toward the lower liquidity pocket near 65,000.
#Bitcoin #Binance #Squarecreater