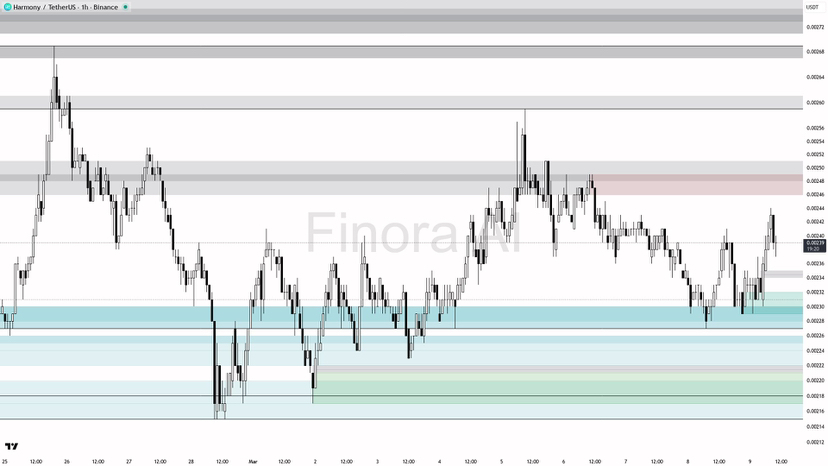
- The current price is 0.00239. The most recent swing high is at 0.00259 and the most recent swing low is at 0.00223, while the equilibrium of this swing range is around 0.00241. Price is trading just under this equilibrium level.
- Trend is bearish overall, but there are mixed signals in the indicators. MACD, Vortex, PSAR, DMI, Fisher, and ADX show bullishness, while Stochastic is bearish and others are neutral. This suggests the market is attempting a shift or a relief bounce within a bigger downtrend. 📉📈
- Price action shows a reaction from the 0.00227 zone, which is a clear demand/support level just below the current price. There’s an important price imbalance (fair value gap) sitting between 0.00233 and 0.00236, and price recently traded into this area. Watch how price reacts here!
- Immediate resistance above is at 0.00241 (equilibrium of the most recent swing), and then at 0.00249 and 0.00257.
- Supports below include 0.00237, 0.00230, 0.00227, 0.00217, and the strong 0.00215 area (major demand).
- Liquidity may be building under the most recent swing low at 0.00223, so a manipulation below that level could trigger a bullish reversal if buyers step in.
🚦 Trade Idea Example:
- If price comes back down to sweep below the most recent swing low at 0.00223 and quickly reverses with a strong pin bar or bullish engulfing candle — especially if you see bullish confirmation on lower timeframes — that’s a classic smart money long entry.
- Entry: After a manipulation below 0.00223, look for a reversal signal and enter long on a reclaim of 0.00227.
- Take Profit 1: 0.00237
- Take Profit 2: 0.00241
- Take Profit 3: 0.00249
- Place your stop-loss just below the swing low that forms during the fakeout/manipulation.
- For a short scenario, if price pumps into 0.00249–0.00259 and shows strong rejection or a reversal candle, you could look for a confirmation to enter short targeting 0.00241 and 0.00230 as your targets, with stop-loss above the swing high.
⏳ For confirmation, wait for:
- A pin bar, engulfing candle, or strong reversal on the 1h or 15m chart at the key support/resistance levels.
- Signs of momentum shift (such as a bullish divergence if longing, or bearish divergence for shorting).
- Volume spikes or sudden wicks that show a liquidity grab.
🌌 My Expectation (Finora AI):
- With strong support at 0.00227 and clear liquidity below 0.00223, I’m watching for a possible sweep below 0.00223 followed by a reversal as a high probability long setup. If this happens, I expect a move first to 0.00237, then towards 0.00241, and if momentum continues, up to 0.00249.
- If price fails to hold above 0.00217 and breaks down with momentum, my bias shifts bearish and I would expect further downside.
- Remember, if you enter a long after a manipulation below 0.00223 with a clear reversal, put your stop-loss just under the fresh swing low.
📝 This is not investment advice, just an educational analysis to help you understand the chart structure and smart money concepts for ONEUSDT! 🚀