 In the world of technical analysis, chart patterns are one of the most powerful tools traders use to predict future price movements. This cheat sheet displays various chart patterns that help identify market trends and possible entry and exit points. Understanding these patterns can significantly improve your ability to make informed trading decisions. Let's break down the key patterns displayed in the chart:
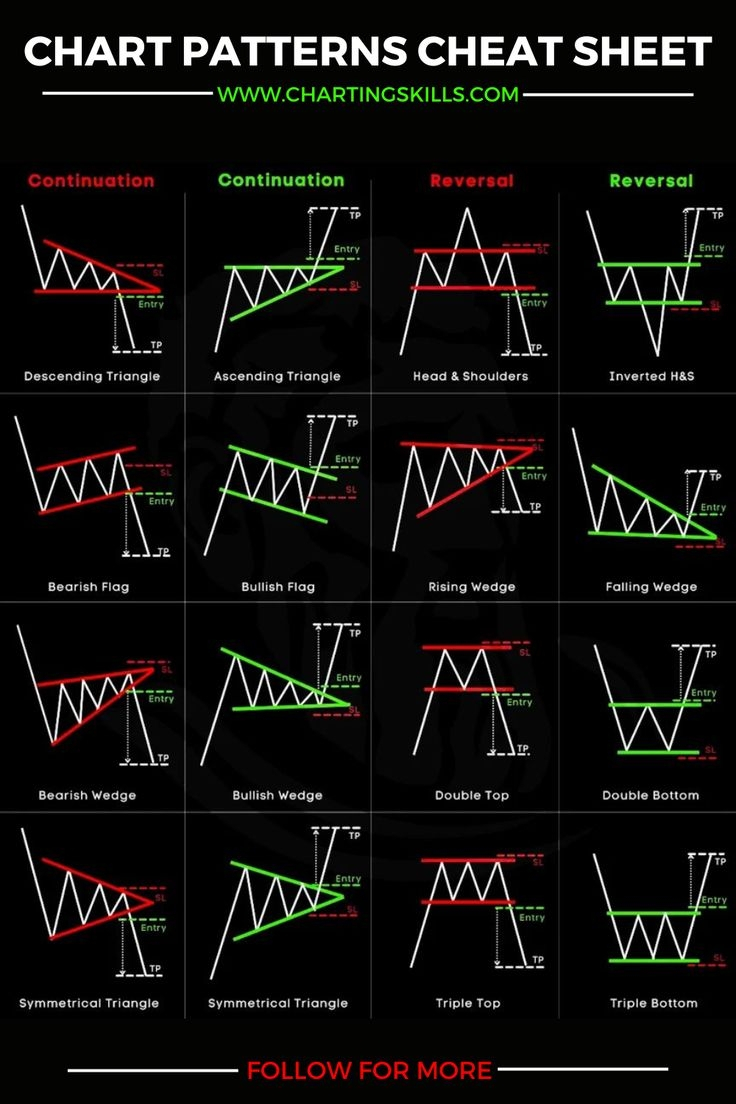
1. Continuation Patterns
Descending Triangle: This bearish continuation pattern forms when the price is in a downtrend and the lower highs continue to form a horizontal line. A break below the support level often signals further downward movement.
Ascending Triangle: A bullish continuation pattern where the price creates higher lows, forming a triangle. Once the price breaks above the upper trendline, it's typically a signal for an upward continuation.
Bearish Flag: This pattern occurs when there is a strong downward movement (flagpole), followed by a consolidation phase that forms a rectangle or flag shape. A breakdown from the flag suggests the continuation of the downward trend.
Bullish Flag: Similar to the bearish flag but in an uptrend. After a sharp upward move, the price consolidates in a downward-sloping flag. A breakout to the upside signals the continuation of the uptrend.
Bearish Wedge: A downward sloping pattern with converging trendlines, signaling a potential reversal or continuation. A break to the downside indicates further bearish movement.
Bullish Wedge: An upward sloping wedge pattern. When the price breaks above the top trendline, it signals a bullish continuation.
Symmetrical Triangle: A neutral pattern where price movements converge to a point. The breakout direction is unpredictable, and it could lead to either an upward or downward movement.
2. Reversal Patterns
Head & Shoulders: This well-known bearish reversal pattern signals that an uptrend is about to turn into a downtrend. The pattern consists of three peaks: the middle being the head, and the two others the shoulders. A break below the neckline confirms the reversal.
Inverted Head & Shoulders: The opposite of the head and shoulders pattern, this bullish reversal indicates a trend reversal from bearish to bullish.
Rising Wedge: This bearish reversal pattern forms during an uptrend and shows a narrowing range with higher highs and higher lows. A break below the lower trendline signals the end of the bullish trend.
Falling Wedge: A bullish reversal pattern that forms when a downtrend narrows. A breakout from the wedge to the upside signals a potential trend reversal.
Double Top: A bearish reversal pattern formed after an uptrend. The price hits a resistance level twice before reversing downward, signaling the end of the bullish trend.
Double Bottom: The opposite of the double top, this bullish reversal pattern occurs after a downtrend when the price hits a support level twice before rallying upward.
Triple Top: A bearish reversal pattern after a strong uptrend. The price tests a resistance level three times before reversing downward.
Triple Bottom: A bullish reversal pattern after a downtrend, where the price tests a support level three times before a price reversal upwards.
Key Takeaways
These patterns serve as a visual roadmap for traders, helping them identify market sentiment and predict potential breakouts or breakdowns. By recognizing and understanding these patterns, traders can make more informed decisions regarding entry, exit, stop loss (SL), and take profit (TP) targets. Always remember that chart patterns should be used in conjunction with other technical indicators and proper risk management techniques to ensure the best results.
Happy trading!