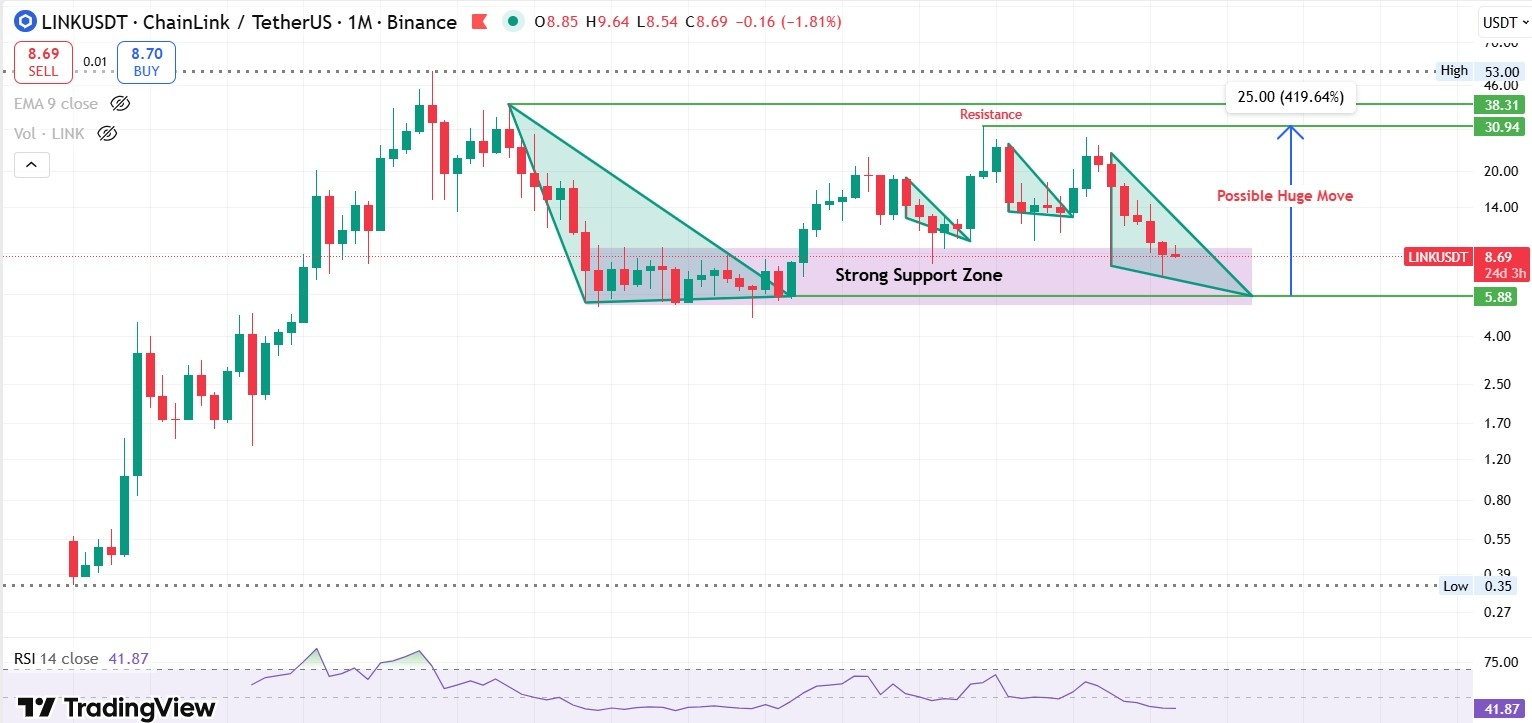
1-month price structure of @Chainlink $LINK , highlighting a key technical setup forming around a major support zone.
After a strong bullish rally earlier in the cycle, #LINK entered a consolidation phase characterized by lower highs and contracting price movements. The chart illustrates four descending triangle patterns, indicating a gradual decline in buying pressure. However, price action is now approaching a strong horizontal support zone between roughly $5.8 and $8, an area where buyers previously stepped in to defend the market.
If LINK holds above this zone and forms a bullish reversal pattern, the chart suggests a potential breakout scenario. A move above the $30–$38 resistance range could trigger strong momentum and open the door for a larger rally.
The projection on the chart points to a possible upside target near $25 above the breakout area, representing a potential move of over 400% if bullish momentum returns to the market.
Meanwhile, the RSI around 41 indicates that LINK is neither overbought nor oversold, leaving room for a reversal if buyers begin accumulating near support.
LINK is currently sitting at a decisive support level. A strong bounce from this area could lead to a major bullish breakout, while losing the support zone may extend the consolidation phase before any large upward move develops.
#BinanceSquare #BinanceSquareFamily #BinanceSquareTalks