The current market view of trading against USDT on Binance reveals an interesting situation developing within the order book. By analyzing the depth chart, traders can observe how buyers and sellers are positioning themselves in the market and where potential price pressure may occur. At the moment, the chart suggests a small but noticeable battle between both sides.
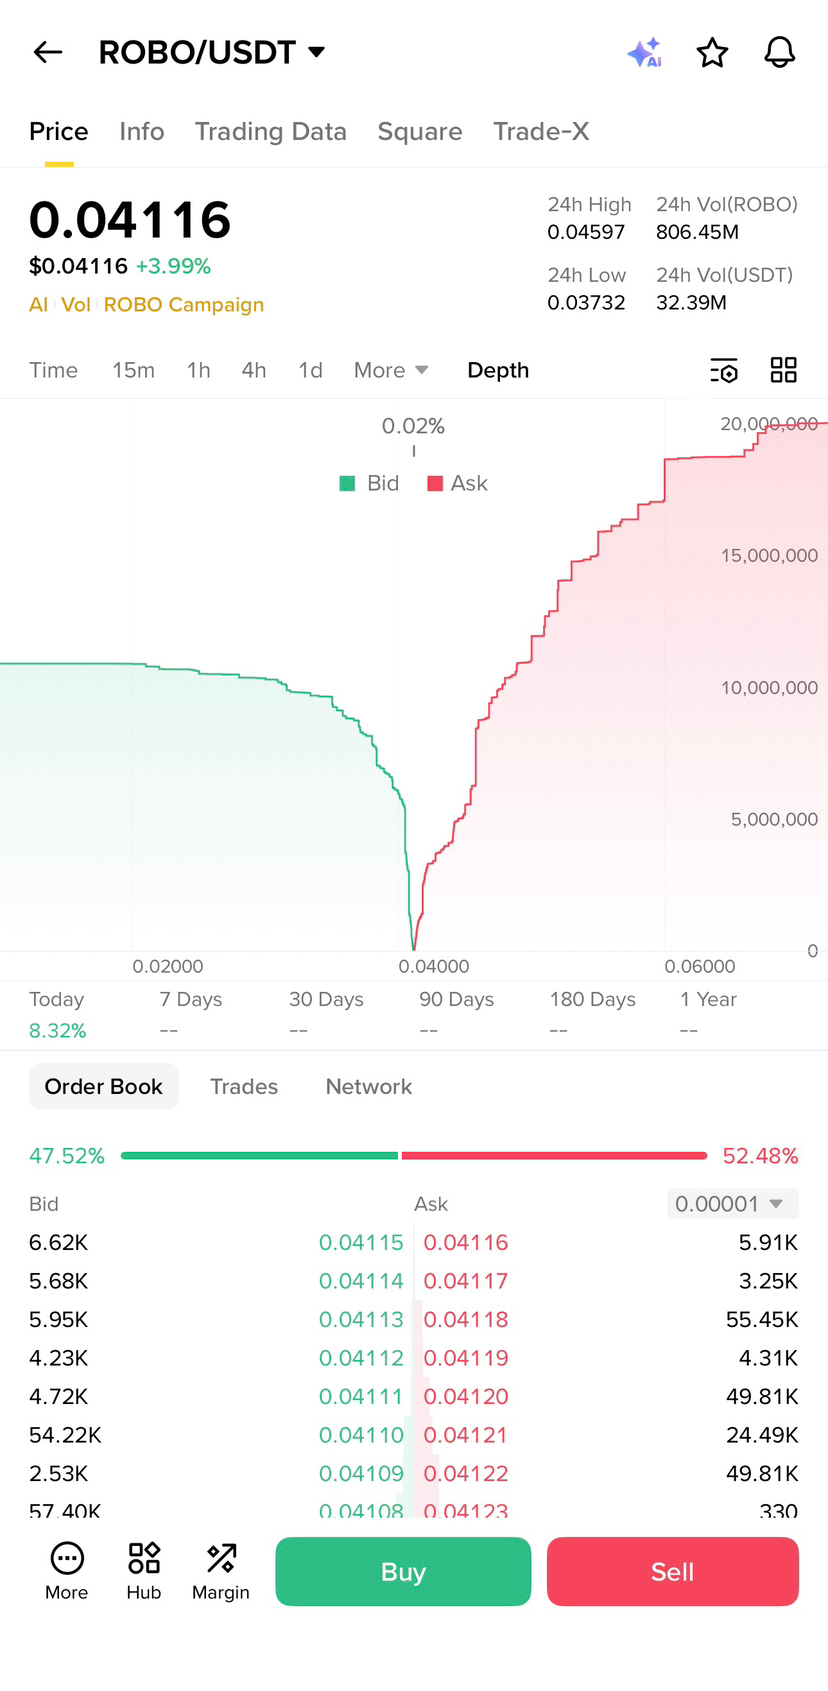
The price is currently hovering around 0.04116 USDT, with the token already showing a modest gain for the day. This indicates that buyers have been attempting to push the market slightly higher, while sellers remain active and ready to lock in profits at nearby levels.
On the depth chart, the green side represents buyers (bids) and the red side represents sellers (asks). The shape and size of these areas show how much liquidity is placed on each side of the market. Right now, sellers hold a slight advantage with approximately 52% ask pressure, while buyers control about 47% of the bid side. This suggests that sellers may slow upward momentum unless buying volume increases.
Looking more closely at the order book, a significant sell wall appears between 0.04118 and 0.04122 USDT. Large orders—such as 55K ROBO and 49K ROBO—are placed in this range. These types of sell clusters often act as short-term resistance levels where traders who purchased earlier attempt to secure profits.
However, buyers are also showing strength. Around 0.04110 USDT, a large buy order of roughly 54K ROBO is waiting in the order book. This creates a potential support level, meaning that if the price dips slightly, buyers may step in to absorb the selling pressure.
To better understand the possible outcomes, consider a simple scenario. If a trader buys 10,000 ROBO at 0.04110 due to the strong support level, and buyers manage to push through the sell wall at 0.04118, the market could move upward quickly. Once those sell orders are filled, the next price movement might extend toward 0.043 USDT or higher as liquidity above gets consumed.
On the other hand, if sellers push the price downward and break the support at 0.04110, weaker buyers may exit their positions. This could lead to short-term panic selling and potentially push the price closer to 0.04000 USDT.
Another interesting element is the shape of the sell side on the depth chart, which rises gradually like a staircase. This pattern often suggests layered sell orders, sometimes associated with larger holders slowly distributing tokens while controlling the pace of price movement.
At the same time, the buy side becomes steeper near 0.04000, showing that many buyers are interested in accumulating ROBO if the price drops slightly. Such behavior often reflects confidence among market participants that the token may still have room for further growth.
Additionally, the 24-hour high around 0.04597 USDT shows that the market has recently tested higher price levels. If buying momentum returns, traders may attempt to push the price back toward that range again.
Based on the current depth structure, three possible short-term scenarios could develop:
1. Buyers break the sell wall, triggering a rapid upward move.
2. Sellers break the support level, causing a short-term price drop.
3. Both sides hold their positions, resulting in sideways movement while traders accumulate.
At this moment, the key levels to watch are 0.04110 as support and 0.04118 as resistance. Whichever level breaks first may determine the next short-term direction for the ROBO token.
Although sellers currently appear slightly stronger in the order book, buyers remain active. If trading volume increases, the visible sell walls could disappear quickly. This is why experienced traders closely monitor market depth and order book structures, as they often reveal potential market moves even before the price begins to change.
#ROBO @Fabric Foundation $ROBO