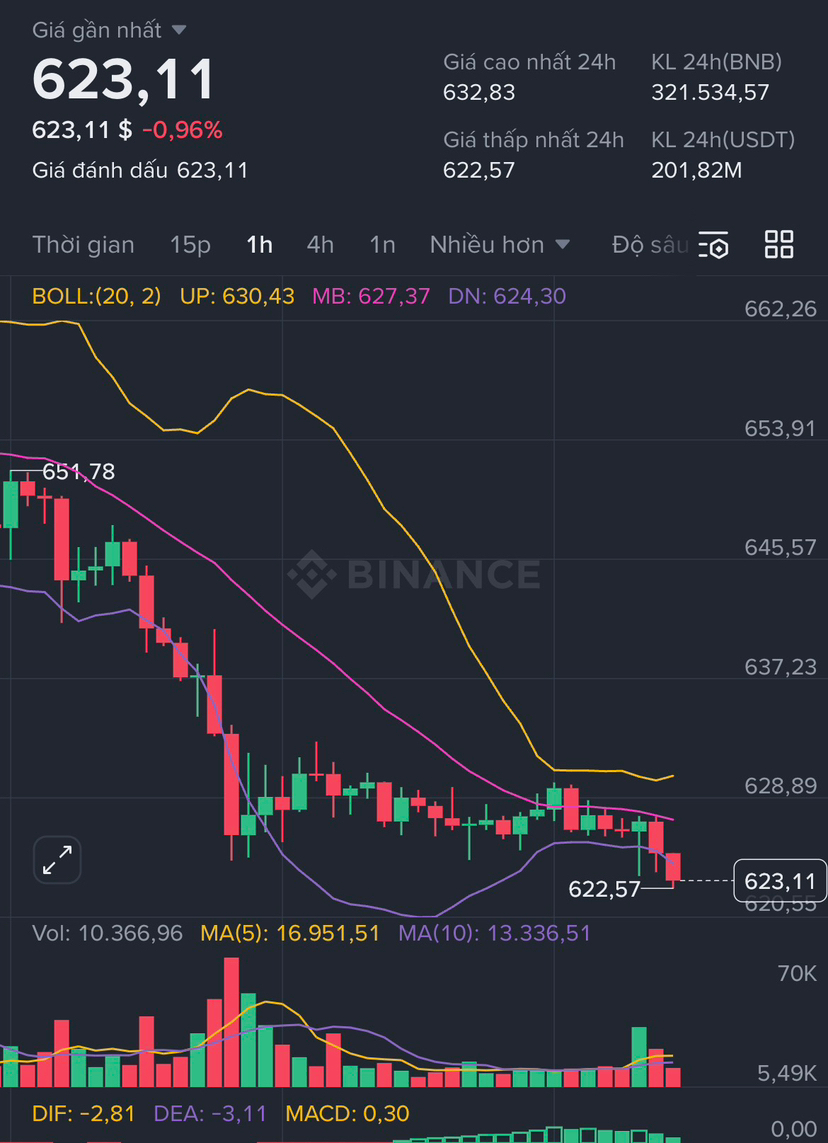
$BNB is currently trading around the 627–628 zone (as of early March 2026), struggling to hold any meaningful ground after multiple failed attempts to reclaim the recent local high of 652–657.

 Price action observations:
Clear lower highs and lower lows structure forming on the daily and 4H timeframes.
Price has decisively closed below both the 7-day and 25-day moving averages, with the MA stack now acting as dynamic resistance.
Weak bounce volume on every retest of the 652–657 supply zone → classic sign of buyer exhaustion.
Key levels to watch:
Immediate resistance: 647–652 (multi-time rejection area + broken neckline of the recent rising wedge → now strong overhead supply).
First major support: 610–614 (previous liquidity pocket + psychological round number). A clean break here would likely accelerate selling toward 587–595 (measured move target from the wedge + higher-timeframe Fib confluence).
Deeper support zone: 570–577 (0.0 Fib retracement of the major leg up from late 2025 lows; widely watched “make-or-break” level).
Current bias (short-term):
Bearish as long as price remains below the 652–657 region with no strong reclaim + volume confirmation. Bulls would need a decisive close above 652 (ideally with expanding volume) to neutralize the current downward pressure and shift structure. Without that, the path of least resistance points toward a liquidity sweep of the 610 area, followed by potential extension toward 595 → 570 if momentum accelerates.
Closest area to monitor in the next few sessions: 610–614. A sustained break below this level would confirm the next leg lower and likely trigger cascading stops / liquidity grabs.
(Technical analysis based on latest price structure and indicators – crypto markets remain highly volatile. For educational / informational purposes only.)