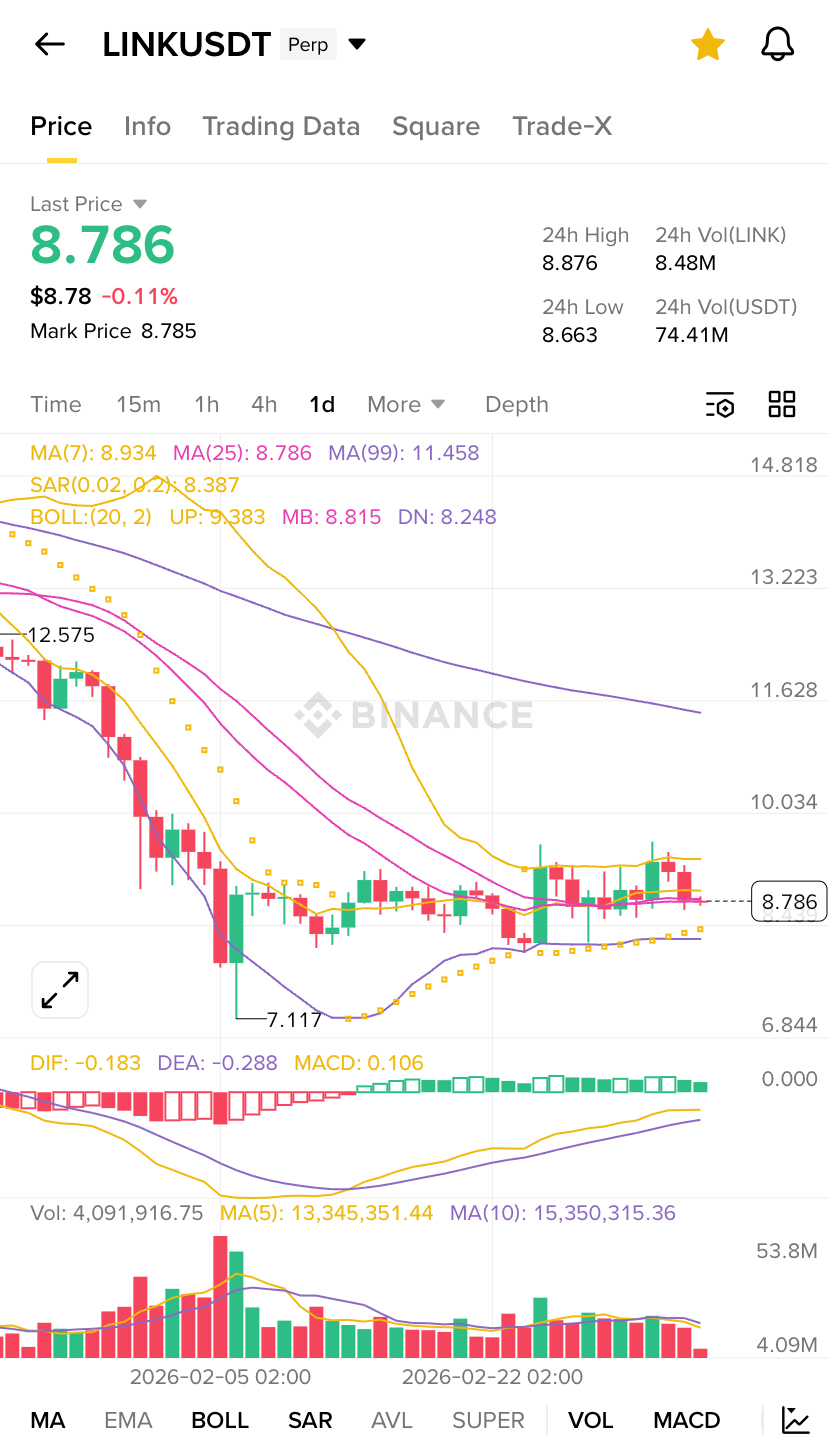
1. Overall Trend
• The chart shows a strong downtrend from about $12.57 → $7.11.
• After hitting $7.11, price started sideways consolidation.
• Current price: ~$8.78.
👉 This means the market is currently in a range after a large drop.
2. Moving Averages (MA)
From the chart:
• MA(7): 8.93
• MA(25): 8.78
• MA(99): 11.45
Interpretation:
• Price is below MA99 → long-term trend still bearish.
• Price is around MA25 → short-term neutral / sideways.
• MA7 flattening → momentum slowing.
📌 Conclusion: Downtrend slowing, but not reversed yet.
3. Bollinger Bands
• Upper band: 9.38
• Middle band: 8.81
• Lower band: 8.24
Current price: 8.78 (near middle band).
Meaning:
• Market is compressing.
• Likely big move coming soon.
📊 Key levels:
• Break above 9.38 → bullish expansion
• Break below 8.24 → bearish continuation
4. MACD
• MACD histogram turned green.
• DIF above DEA.
This suggests:
✅ Short-term bullish momentum building.
But it is weak, so confirmation still needed.
5. Parabolic SAR
• SAR dots are below candles.
This indicates:
📈 Short-term bullish signal.
However it can flip quickly in sideways markets.
Key Levels to Watch
Major Support
• $8.25 → Bollinger lower band
• $7.10 → strong bottom support
Major Resistance
• $9.38 → Bollinger upper band
• $10.00 – $10.30 → strong resistance
• $11.45 → MA99
Possible Scenarios
🟢 Bullish Scenario
If LINK breaks $9.40 with volume:
Targets:
• $10.00
• $10.80
• $11.40
This would mean trend reversal starting.
🔴 Bearish Scenario
If price loses $8.25:
Targets:
• $7.70
• $7.10
That would mean continuation of the downtrend.
My Trader’s View
Right now this looks like:
Accumulation / range zone
between roughly:
$8.2 – $9.3
Large move likely after breakout.
✅ Short idea: near 9.3 resistance
✅ Long idea: near 8.2 support
(but always confirm with volume)