1. Trend & Moving Averages
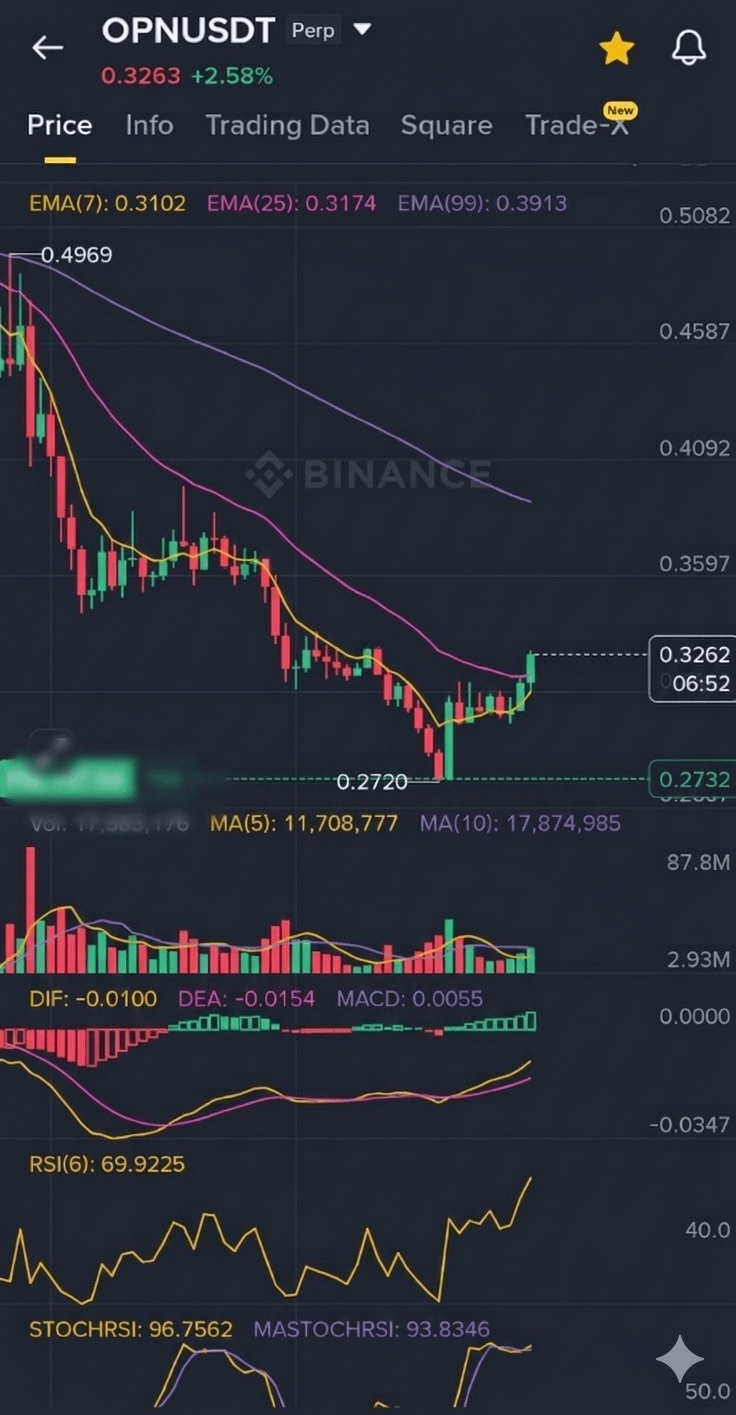
Bullish Momentum: The price is currently trading at 0.3262, showing a recent upward move.
EMA Crossover: The EMA(7) (yellow) has crossed above the EMA(25) (pink), which is a short-term bullish signal indicating upward momentum.
Long-term Resistance: The price remains significantly below the EMA(99) (purple) at 0.3913, which serves as the primary overhead resistance level.
2. Momentum Indicators🚦🧑🏫
RSI (6): The Relative Strength Index is at 69.92, approaching the overbought territory (>70). This suggests that while the trend is strong, a temporary pullback or consolidation may occur soon.
MACD: The MACD histogram is green and showing positive values (0.0055), confirming that the buyers are currently in control of the market.
Stochastic RSI: Both the K and D lines are at the top of the range (96.75), indicating the asset is heavily overbought in this specific timeframe.
 OPNUSDTPerp0.3404+8.20%
Summary & Strategy
The chart shows a strong recovery from the recent lows, supported by a bullish EMA crossover and positive MACD momentum. However, because the Stochastic RSI and RSI(6) are at very high levels, entering a new "Long" position at this exact price may be risky.
Recommendation: If you are already in a trade, consider trailing your Stop Loss higher to protect your profits. Watch for a potential rejection near the 0.39 level (EMA 99) as a place to take partial profits