The technical indicators of BCH/USDT present a mixed outlook. The price is currently at 449.15, trading below all key EMAs (9, 21, and 100), which typically signals a bearish trend. However, the MACD shows a bullish crossover with a positive histogram (0.45), indicating increasing upward momentum. The RSI(6) at 46.55 is neutral, neither oversold nor overbought, suggesting room for movement. The recent price uptick of +0.97% could be a short-term bounce within a larger downtrend.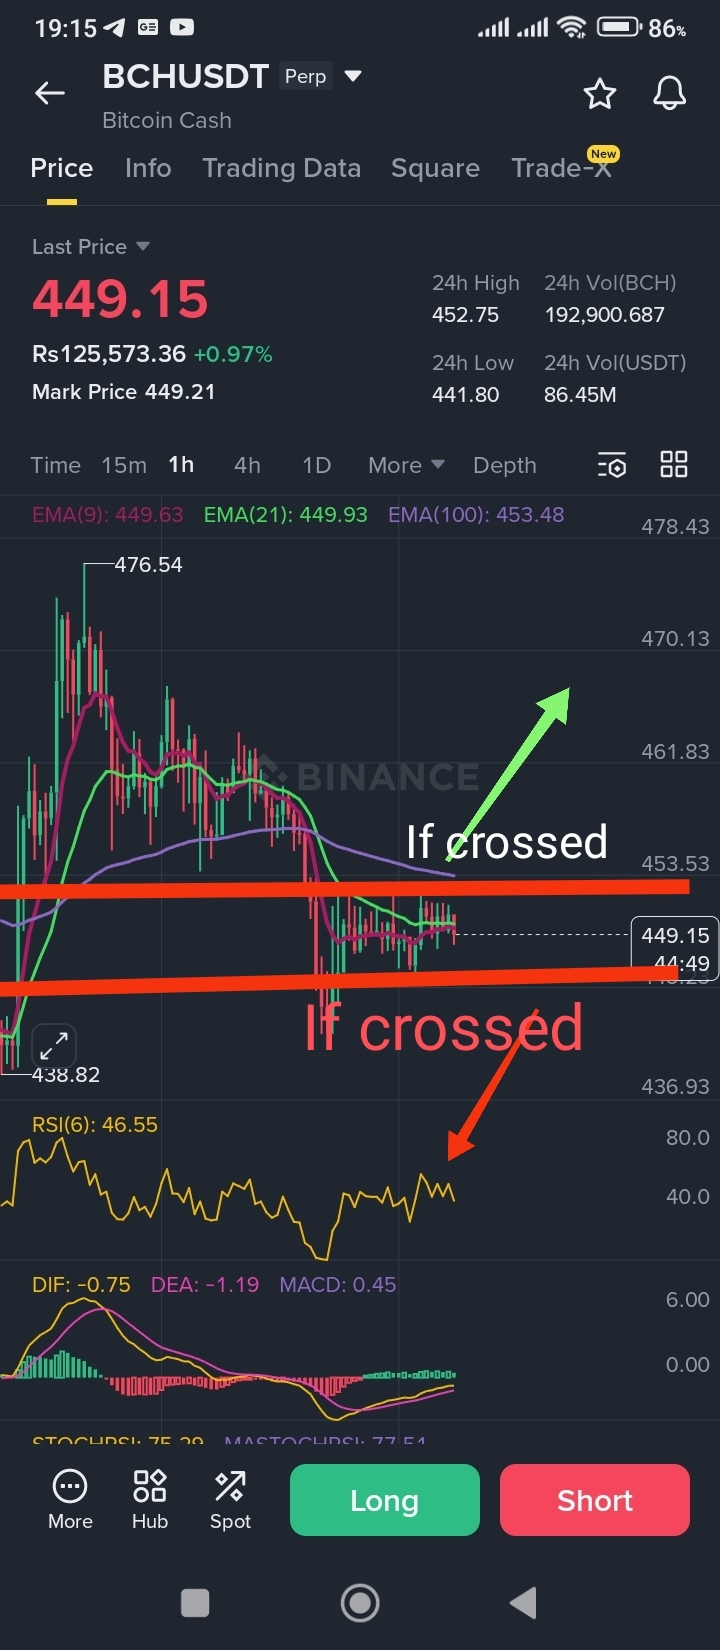
Given that price is below the EMAs, the path of least resistance is still downward. A short position might be considered if price fails to break above the immediate resistance at the EMA9 ($449.63) or EMA21 ($449.93), with a stop loss above 452 to manage risk. Conversely, a sustained move above these EMAs could trigger a long opportunity, targeting the next resistance near $461.83. However, given the bearish trend, shorting at resistance with tight risk management may be the safer play. Always use proper stop-losses and consider market conditions before entering.
"Always DYOR"
