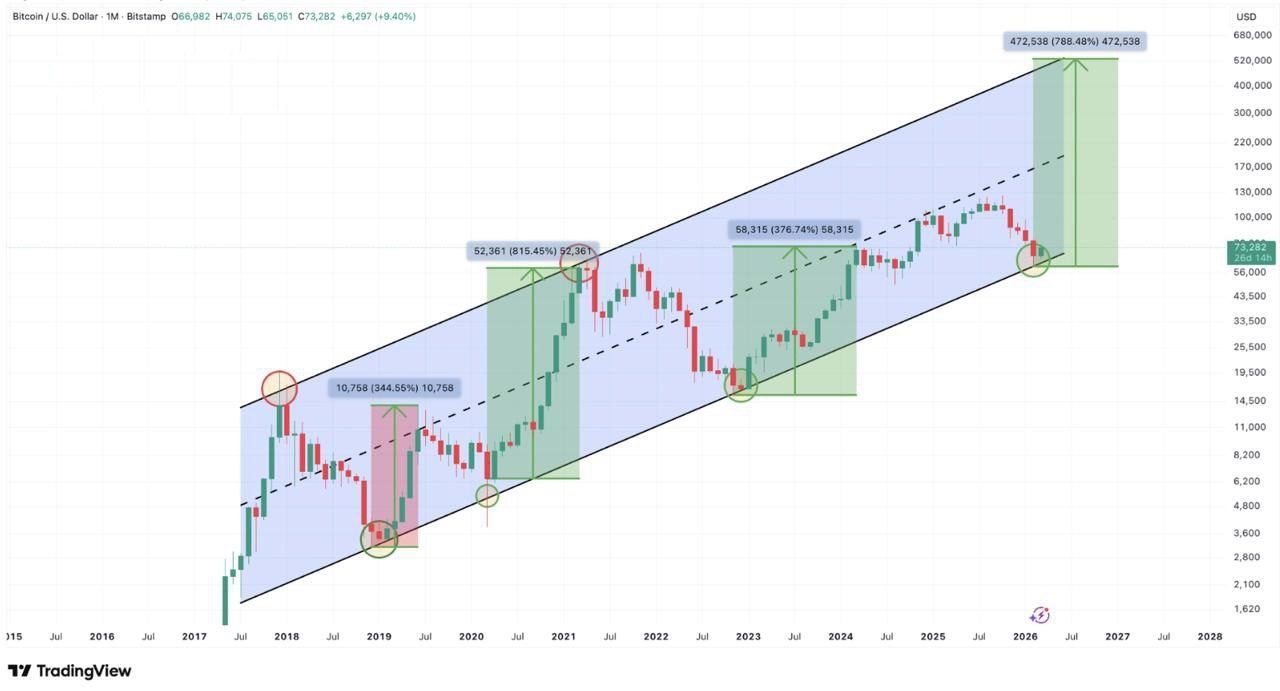
A popular chart circulating on X suggests that Bitcoin is currently testing a multi-year trendline that has historically marked major market bottoms on the monthly timeframe.
According to this analysis, BTC approaching this long-term support could indicate that the market is close to forming a macro bottom — potentially setting the stage for a massive long-term move, with some projections pointing as high as $500K.
However, the key nuance is the timeframe. On the monthly chart, Bitcoin could still close March around $60K and the long-term trend would remain intact.
In other words, short-term volatility doesn’t necessarily break the broader structure.
The bigger picture suggests that as long as BTC holds this multi-year trendline, the long-term bullish scenario remains possible.
Articolo
Could Bitcoin reach $500,000?
Disclaimer: Include opinioni di terze parti. Non è una consulenza finanziaria. Può includere contenuti sponsorizzati. Consulta i T&C.
0
0
1
Esplora le ultime notizie sulle crypto
⚡️ Partecipa alle ultime discussioni sulle crypto
💬 Interagisci con i tuoi creator preferiti
👍 Goditi i contenuti che ti interessano
Email / numero di telefono