Understanding the Current Buyer vs. Seller Dynamics
The current $ROBO trading pair on is presenting an interesting market structure, where buyers and sellers are actively competing for short-term control. By analyzing the depth chart and order book, traders can gain valuable insight into liquidity distribution and potential price direction for , the native asset connected to the ** ecosystem.
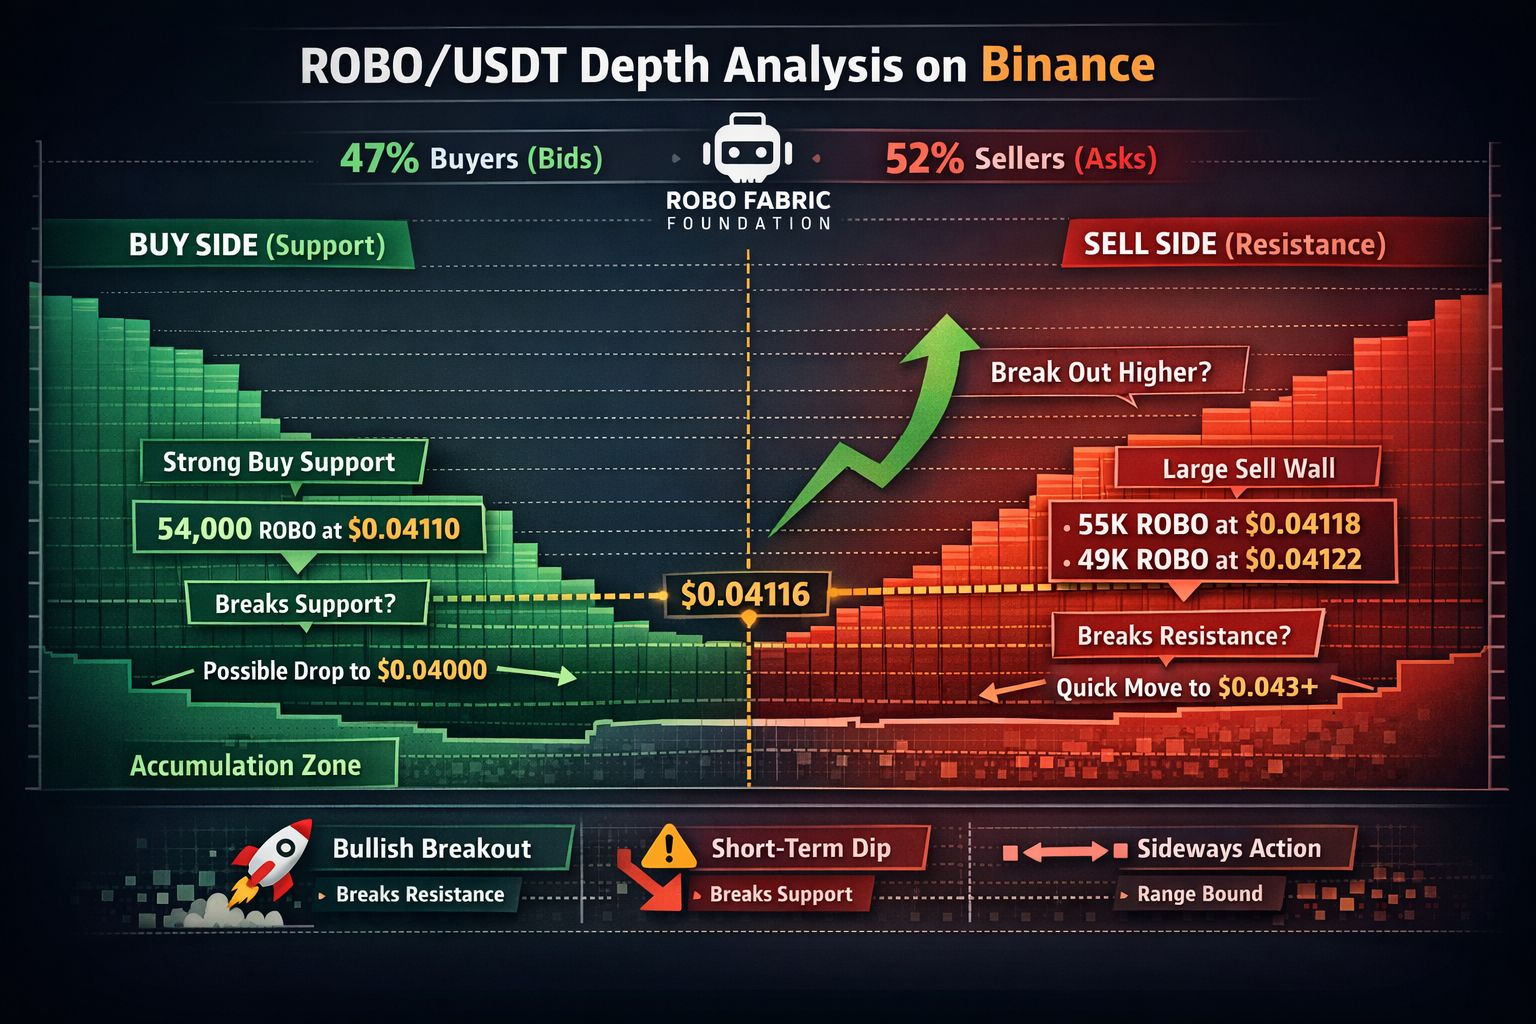
At the time of observation, ROBO is trading around 0.04116 USDT, showing moderate positive movement during the session. The depth chart reveals a relatively balanced market with a slight advantage on the seller side, suggesting a temporary resistance but not necessarily a bearish trend.
Current Market Balance: Buyers vs. Sellers
The depth chart clearly illustrates the interaction between Bid (buyers) and Ask (sellers) liquidity.
Ask pressure: ~52%
Bid pressure: ~47%
This indicates that sellers currently hold a small liquidity advantage, meaning they may attempt to slow the upward price movement. However, in active markets—especially those connected to developing ecosystems like the Robo Fabric Foundation—buying momentum can rapidly absorb sell orders if trading volume increases.

Key Resistance Zone: Sell Walls Near 0.04118–0.04122
A notable concentration of sell orders appears between 0.04118 and 0.04122 USDT.
Large orders in this range include:
~55,000 ROBO
~49,000 ROBO
This cluster forms what traders often refer to as a sell wall. Such walls act as short-term resistance levels, typically placed by traders who accumulated tokens earlier and are now seeking quick profit-taking opportunities.
If market demand rises and buyers aggressively execute market orders, these sell walls can be absorbed quickly, potentially triggering a rapid upward move.
Key Support Level: Strong Buyer Liquidity Near 0.04110
On the buyer side, a significant buy order of approximately 54,000 ROBO is positioned around 0.04110 USDT.
This creates a support liquidity zone, where buyers appear ready to absorb selling pressure. Support zones like this often signal confidence among market participants who believe the token may still have upside potential.
For example:
A trader purchasing 10,000 ROBO near 0.04110 could benefit if buyers push through resistance at 0.04118.
If the sell wall breaks, the price could quickly move toward 0.043 USDT or higher, as market orders consume remaining liquidity.
Alternative Scenario: Breakdown Below Support
While the support level appears strong, a break below 0.04110 could change market sentiment in the short term.
If sellers push through this level:
Late buyers may exit positions
Short-term traders may trigger stop losses
Price could retrace toward the 0.04000 USDT region
This type of move is common in crypto markets when support liquidity is suddenly removed or overwhelmed.
Order Book Structure: Layered Sell Orders
Another important observation from the depth chart is the gradual staircase structure on the sell side.
This layered distribution of sell orders often indicates:
Strategic profit-taking
Controlled token distribution
Attempts by large holders to slow price acceleration
In many cases, this pattern is associated with whales gradually distributing tokens while maintaining price stability.
Buyer Accumulation Signals
Despite the slight seller advantage, the buy side becomes significantly steeper near the 0.04000 range. This suggests strong interest from participants looking to accumulate ROBO at discounted prices.
Such depth patterns typically appear when traders believe the project—such as the one being developed by the Robo Fabric Foundation—still holds future growth potential.
Context: Previous Price Levels
The 24-hour high near 0.04597 USDT indicates that ROBO has recently tested higher levels. If buying momentum returns and resistance levels are cleared, the market may attempt to revisit or challenge those highs.
Possible Short-Term Market Scenarios
Based on the current depth structure, three main scenarios are possible:
1. Bullish Breakout
If buyers absorb the sell wall around 0.04118, the market could move quickly upward as liquidity gaps open above resistance.
2. Short-Term Pullback
If sellers push through 0.04110 support, the price may temporarily decline toward 0.04000 before stabilizing.
3. Sideways Accumulation
If both liquidity zones hold, ROBO could trade in a narrow range, allowing traders and investors to accumulate positions.
Why Depth Charts Matter
For traders monitoring ROBO/USDT, the depth chart provides early insight into market sentiment and liquidity positioning.
In many cases, the story of the market is already visible in the order book before price movements occur. Observing how buyers and sellers interact around key liquidity zones can help traders anticipate potential breakouts, pullbacks, or consolidation phases.
Within the broader vision of the Robo Fabric Foundation, these market dynamics reflect the growing activity and participation surrounding the ROBO ecosystem, as traders and investors evaluate its future potential in the digital asset space.