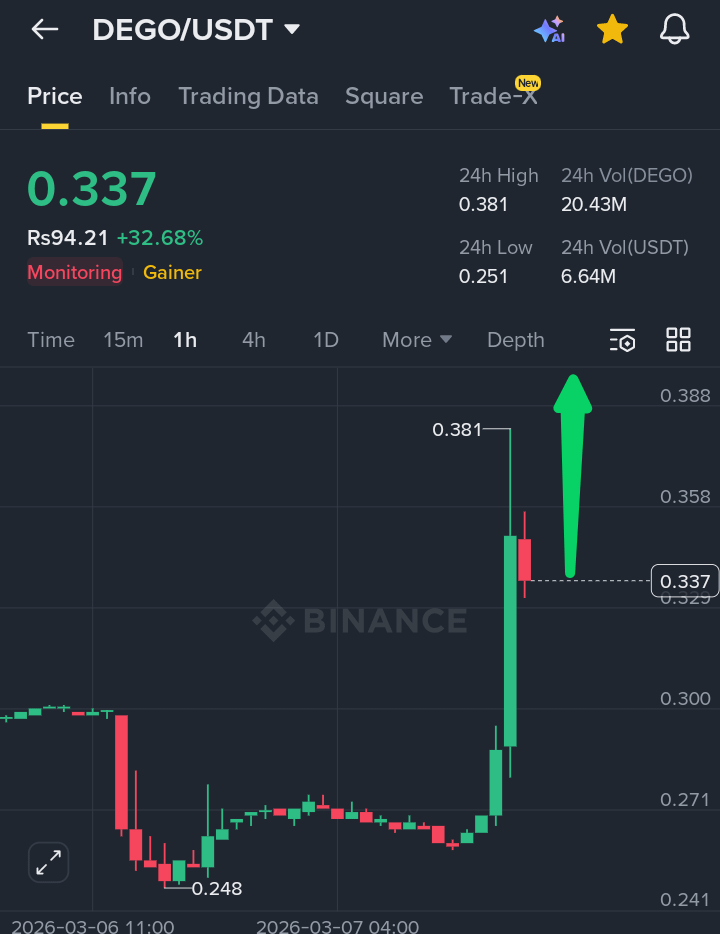
$DEGO has surged more than 30% 📈 in the last 24 hours, climbing from the $0.25 area to a high near $0.38. The rally appears to be driven by a strong breakout after a long consolidation phase around the $0.26–$0.28 range. When an asset trades sideways for an extended period, liquidity builds up, and once resistance breaks, momentum traders and short liquidations can accelerate the move.
🔍 Technical Breakout and Liquidity
The chart shows that $DEGO formed a base near $0.24 earlier before gradually creating higher lows 📊. This structure indicates accumulation, where larger market participants slowly build positions. Once price broke above the $0.30 resistance, buy orders and momentum traders pushed the price sharply higher, resulting in the vertical move toward $0.38.
📈 Volume and Market Momentum
Another key factor behind the pump is the sudden spike in trading volume. Increased volume usually confirms that the move is supported by real market participation rather than just low liquidity spikes. When volume expands during a breakout, it often attracts additional traders looking to capture short term momentum.
📉 Possible Pullback Scenario
After such a rapid rally, short term corrections are common. If profit taking increases, $DEGO could retest support zones near $0.31 or $0.29 📉 before deciding the next direction. Holding these levels would keep the bullish structure intact and allow the market to build another base.
📊 Key Levels to Watch
Support Zones: $0.31 → $0.29 → $0.26
Resistance Zones: $0.38 → $0.42 → $0.48 📈
If bullish momentum continues and the broader crypto market remains stable, DEGO could attempt another breakout above the $0.38 resistance. However, traders should always watch $BTC direction because overall market sentiment often controls liquidity flow across altcoins.
#DEGO #CryptoMarket #altcoins #BinanceSquare #cryptotrading