If you've ever been caught in a fake rally right before a major crash, chances are the Head and Shoulders pattern had already formed on the chart and you missed it. Here's everything you need to know in under 5 minutes.
What Is the Head and Shoulders Pattern?
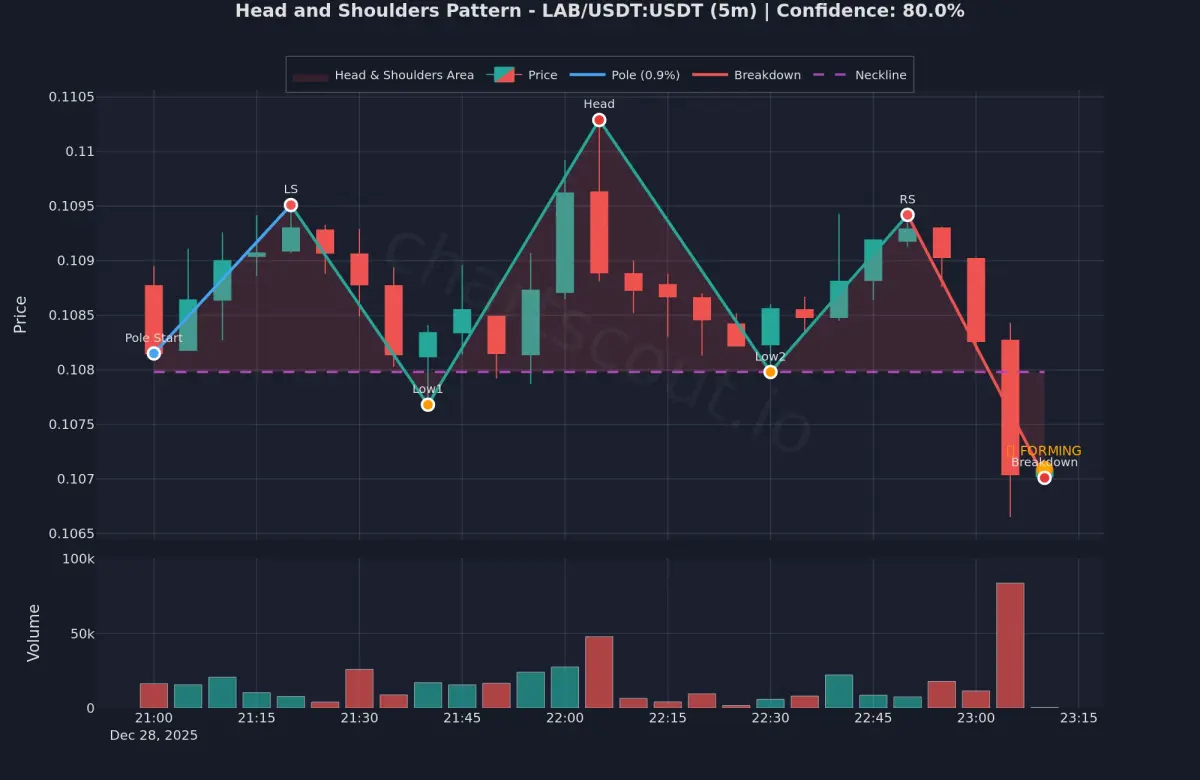
It's one of the most reliable bearish reversal patterns in trading. Three price peaks where the middle peak (the head) is the highest, flanked by two lower peaks (the shoulders). It signals that an uptrend is running out of fuel and a significant drop is coming.
The 5 Parts You Need to Spot
Left Shoulder - First rally and pullback during an uptrend
Head - Bulls push to a new high, then fail to hold it
Right Shoulder - A weaker rally that can't match the head
Neckline - A line connecting the two troughs between the peaks
Breakout - Price closes below the neckline, confirming the pattern
The Stats (2,800+ Trades)
According to Thomas Bulkowski's research:
✅ Success Rate: 81% (only 19% failure)
📉 Average Decline: 16% after neckline break
🔄 Pullback Rate: 68% price often retests the neckline before dropping
🎯 51% of patterns reach the full measured move target
In crypto, a 16% projected decline can easily hit 25–40% on altcoins due to higher volatility.
How to Trade It: Step-by-Step
Wait for the neckline break - Never enter early, always wait for confirmation
Check volume - Declining volume on the right shoulder is your key signal
Set your target - Measure head-to-neckline distance, project it downward from breakout
Place your stop-loss - Just above the right shoulder
Watch for the pullback - 68% of the time price retests the neckline before dropping further
Failure Rates and Risk Management
Even an 81% reliable pattern fails 19% of the time. Common causes:
Pattern forming against a strong bull market
No volume confirmation on the neckline break
Entering too early before confirmation
Sudden news events overriding technicals
💡 Busted Pattern Tip: When an H&S fails and price reverses back above the neckline, it often rallies 21–40%. A stop-loss hit might actually signal a buying opportunity.
Inverse Head and Shoulders: The Bullish Version
The mirror image of the top signals bullish reversals.
81% success with only 3–4% failure rate
Average rise: 38% in bull markets
74% of patterns meet the full price target in bull markets
Throwbacks occur 45% of the time without a throwback, performance is stronger (43% rise vs. 32%)
Complex Head and Shoulders
Multiple shoulders or heads in one pattern. Takes longer to form (3–3.5 months) but shows similar reliability. The more complex the pattern, the more intense the battle between buyers and sellers and the stronger the resulting move.
Crypto-Specific Tips
BTC & ETH - Most reliable, closest to traditional market behavior
Mid & small caps - Higher failure risk due to low liquidity and manipulation
24/7 markets - Patterns form faster a 70 day stock pattern can complete in days on crypto hourly charts
Always confirm with volume especially on lower liquidity pairs
Frequently Asked Questions
Should I enter before the neckline breaks? No. Always wait for a candle close below the neckline. Anticipating the break is one of the most common and costly mistakes.
How long does the pattern take to form? Around 70 days on average in traditional markets. In crypto, formation is often compressed significantly.
Is the inverse pattern more reliable? Yes the inverse H&S has a higher target achievement rate (74% vs. 51%) and a lower failure rate (3–4%).
The #1 Rule
The neckline break is your signal not the shape forming. Patience is your edge.
Tools like ChartScout detect Head and Shoulders patterns across Binance, Bybit, KuCoin, and MEXC in real time, sending alerts in under 20 seconds so you never miss a setup again. 🚀
Full Article: https://chartscout.io/head-and-shoulders-pattern
Disclaimer: This is educational content only, not financial advice. Crypto trading involves substantial risk. Always do your own research and never invest more than you can afford to lose.
#headandshoulders #TechnicalAnalysis #tradingeducation #chartpattern
___________________________________________________________
Data source: Thomas Bulkowski, thepatternsite.com (updated 2020, 2,800+ trades)